
I was waiting for an excuse for me to look deeper into the long throw-ins for a while now, but I couldn’t find the right hook. Now, it’s all over the place, and I know my research is far from innovative, but I do still think there are so many interesting things we could talk about. Long throw-ins seem to be emerging in the Premier League, but is this a league specific trend or can we see some similar development in the other top leagues in Europe? Let me take you on a wonderful trip through long throw-ins.
In this article, I will discuss what a long throw-in is and delve into what this means for football in the specific leagues. Furthermore, I won’t only look at the percentages, but also look at where they occurred, where they landed and which value can be gained from this.
There are two pieces which really got my attention:
- https://www.nytimes.com/athletic/6613474/2025/09/12/tuchel-england-long-throws/?source=twitteruk
- https://analyticsfc.co.uk/blog/2024/06/18/long-throw-ins-scouting-to-find-marginal-gains/
I wanted to have a look at what the trends suggest for the 2025-2026 season and whether the Premier League has been doing something different from the rest.
Contents
- Data collection
- What is a long throw-in?
- Which league does long throw-ins the most? (count of long throw in)
- Where do long throw-ins land?
- What value do long throw-ins have?
- Which teams are the best in volume and in quality?
- Final thoughts
Data collection
Most of the time, this data comes from the Opta API, which I have accessed through Python. I use Python more than R, but both are possible for getting the data and doing the data analysis for. I have collected all raw event data from the 2022-2023, 2023-2024, 2024-2025 and the ongoing 2025-2026 season. All the data was collected on September 25th 2025. This is important for when you read this article in the future.
The data is raw event data, which is all on-ball positional (XY) data for the seasons described above. What I did next was to make sure I only had the specific set pieces from the data: free kicks, throw-ins, penalties and corners. I’ve excluded goalkicks and kick-offs, but perhaps in different research this will pop up.
What is a long throw-in?
Before we get into the data analysis part, we need to engineer and construct the metric we want to use. According to Opta this is what a throw-in is: It refers to the restart of play from a sideline, not a pass. It is a set piece, not an open play event. Now they are a few things I want to change:
- We want a throw-in pass, so we need to calculate end locations (endX, endY)
- Success rate %: successful throw-ins vs total attemped throw-ins.
- A long throw in is characterised by me as a throw-in in the final third that goes into the penalty area.
Long throw-ins: a qualitative comparison
The idea was coined that the long throw in is back following the first few Premier League Matches, especially looking at Manchester City and Arsenal. Let’s have a look at the numbers of the last 10 seasons. We focuson the percentage of total throw-ins that re long throw-ins in the final third going into the box:
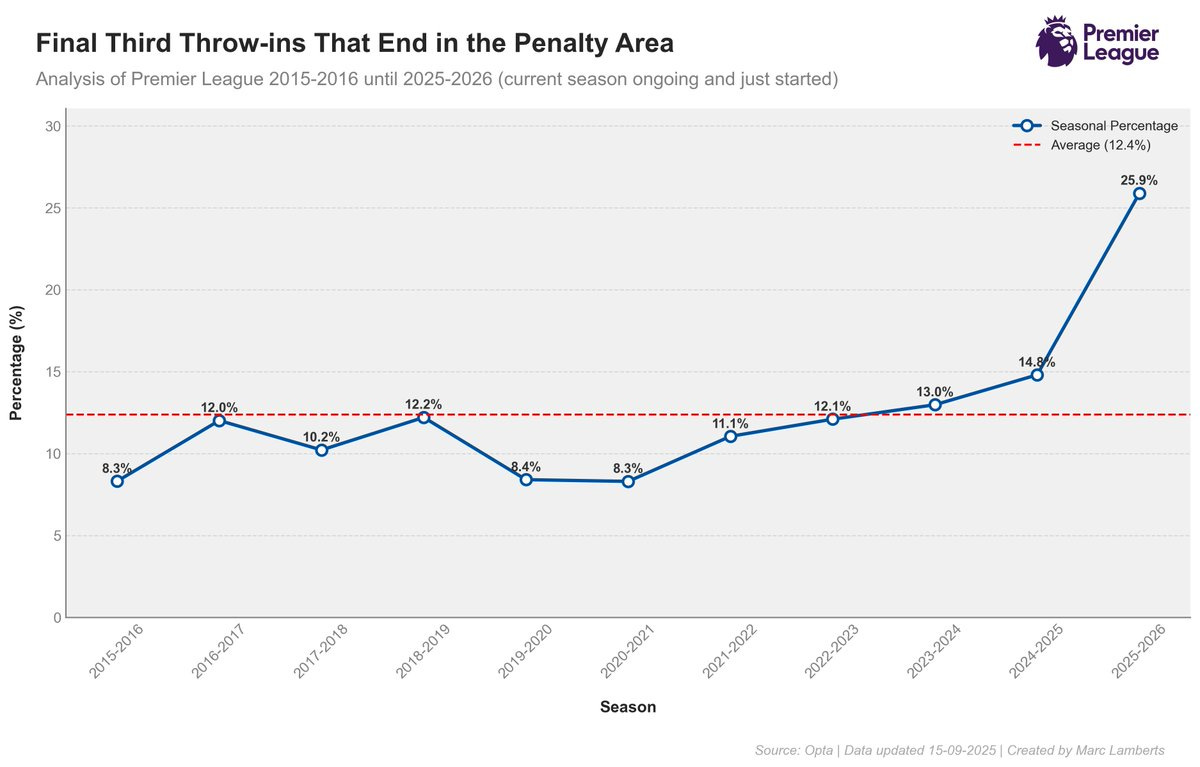
In the line graph above you see the results of our calculations. The average percentage of throw-ins that end in the box is 12,4% with a growth starting from 2020-2021 from 8,3% to 14,8% in 2024-2025. What’s interesting to see is that there is an explosive growth happening in this season so far, with more than a quarter of the throw-ins in the final third ending in the box: 25,9%.
One of the bigger questions is: Premier League trend or nah? Let’s have a look at the last 4 seasons and compare them to the other big leagues (Bundesliga, La Liga, Serie A and Ligue 1):
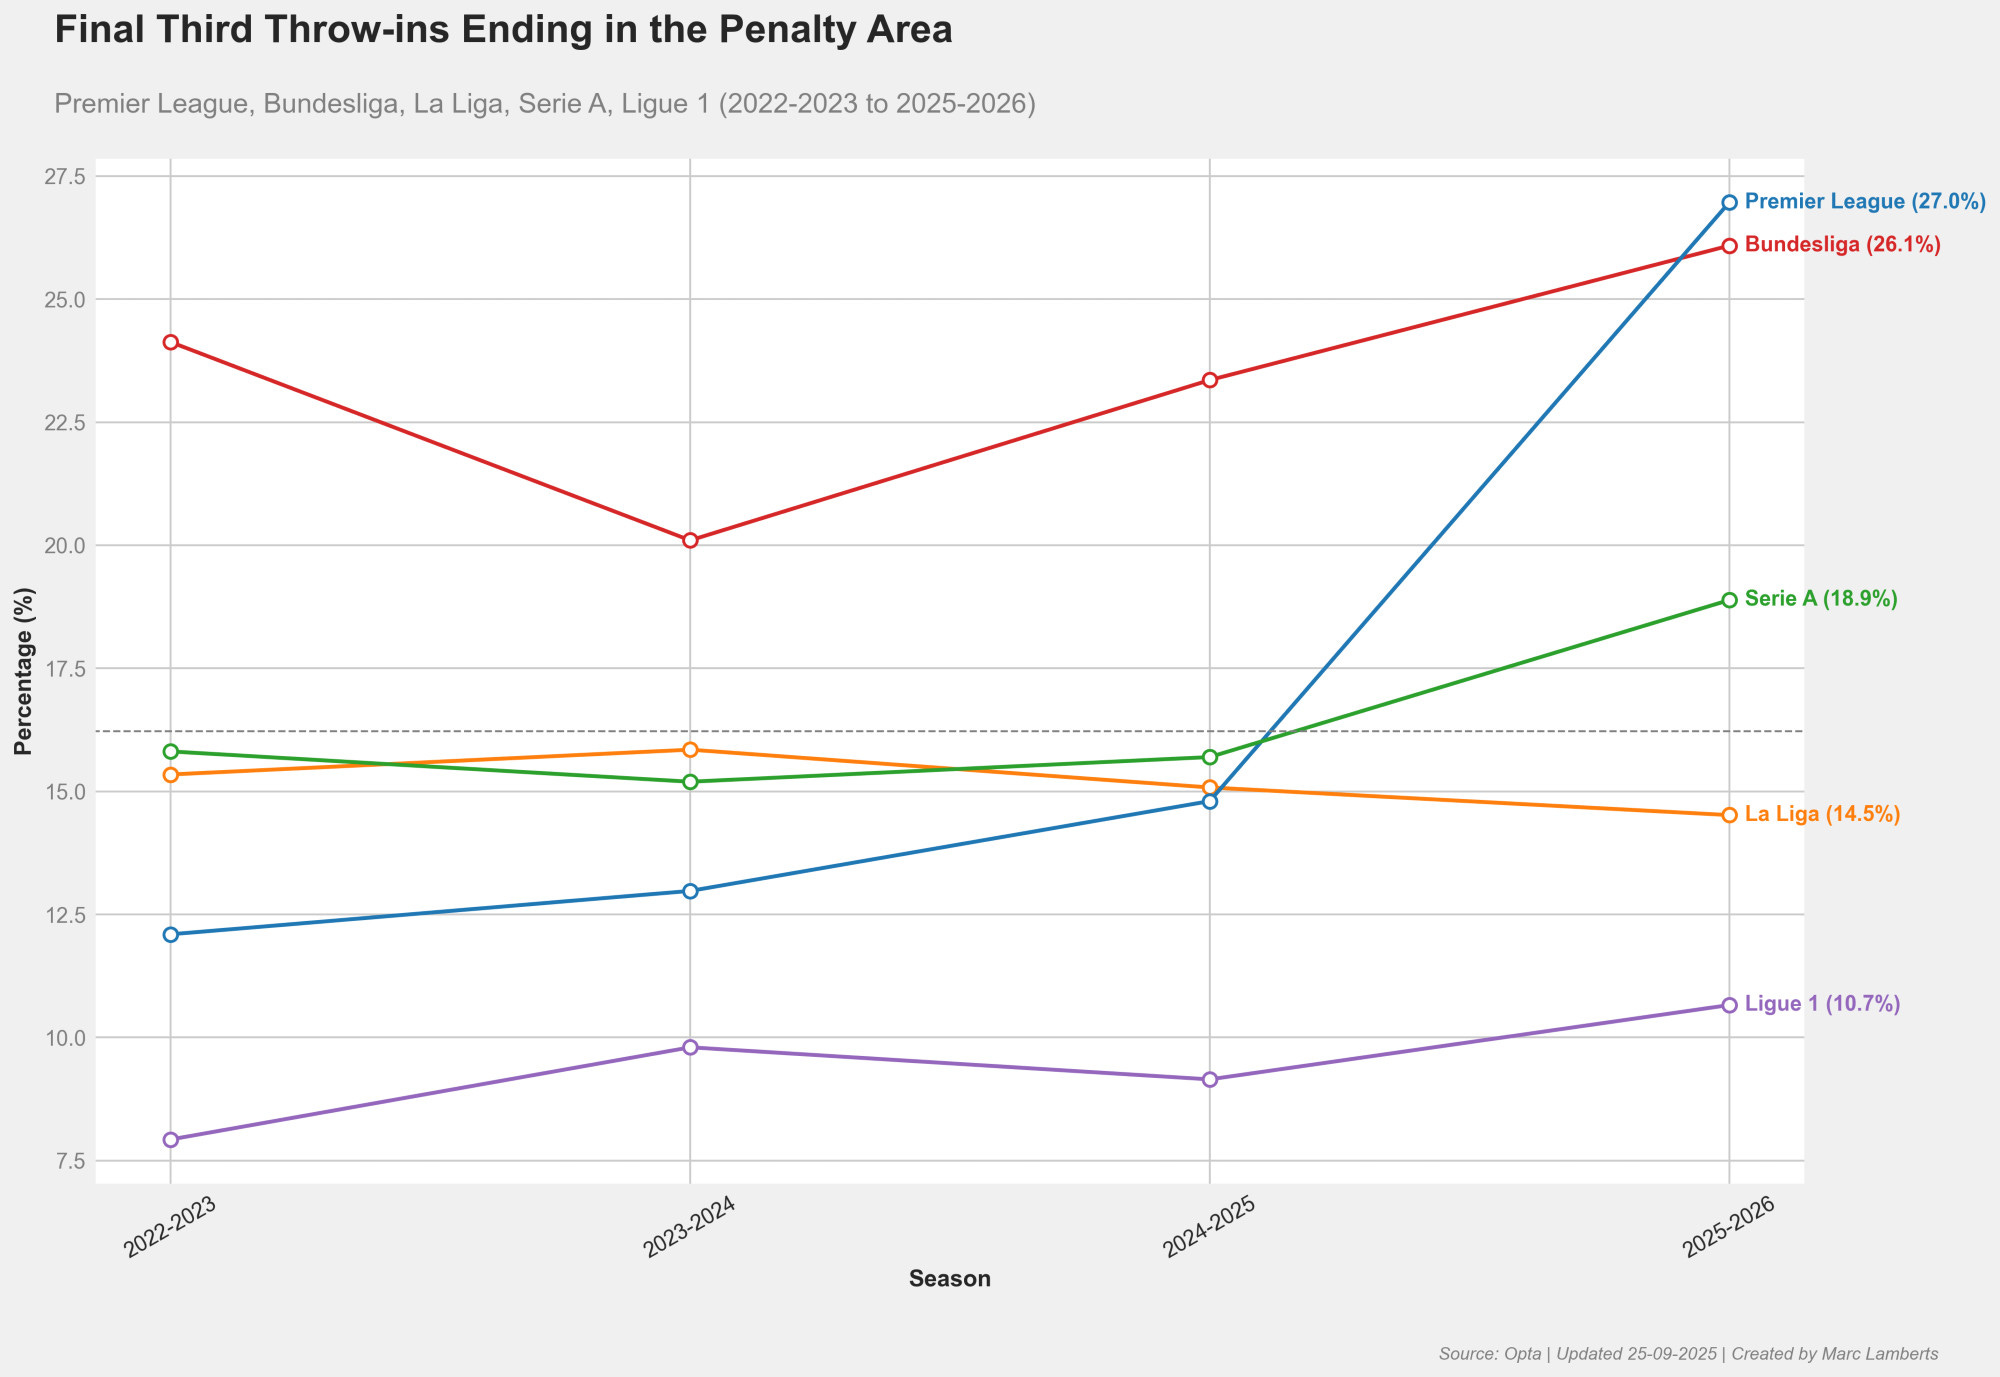
In the graph above you see all top 5 leagues in Europe compared for the long throw-ins. We can see a few interesting things:
- Bundesliga has been leading the trend and always has scored higher, but now Premier League is highest
- Premier League has had an explosive growth, from 4th to 1st place in terms of long throw-ins
- Serie A grows slightly as well, but still under the 20%
- Ligue 1 and La Liga stay steady, but also have no change in terms of long throw-ins.
Where do throw-ins land?
If we look at the more qualitative nature of our comparison, it’s evident that we want to look at the locations of the throw-ins. These locations can say a lot. A long throw-in from the edge of the final third or the middle of the final third, can say a lot about intentions.
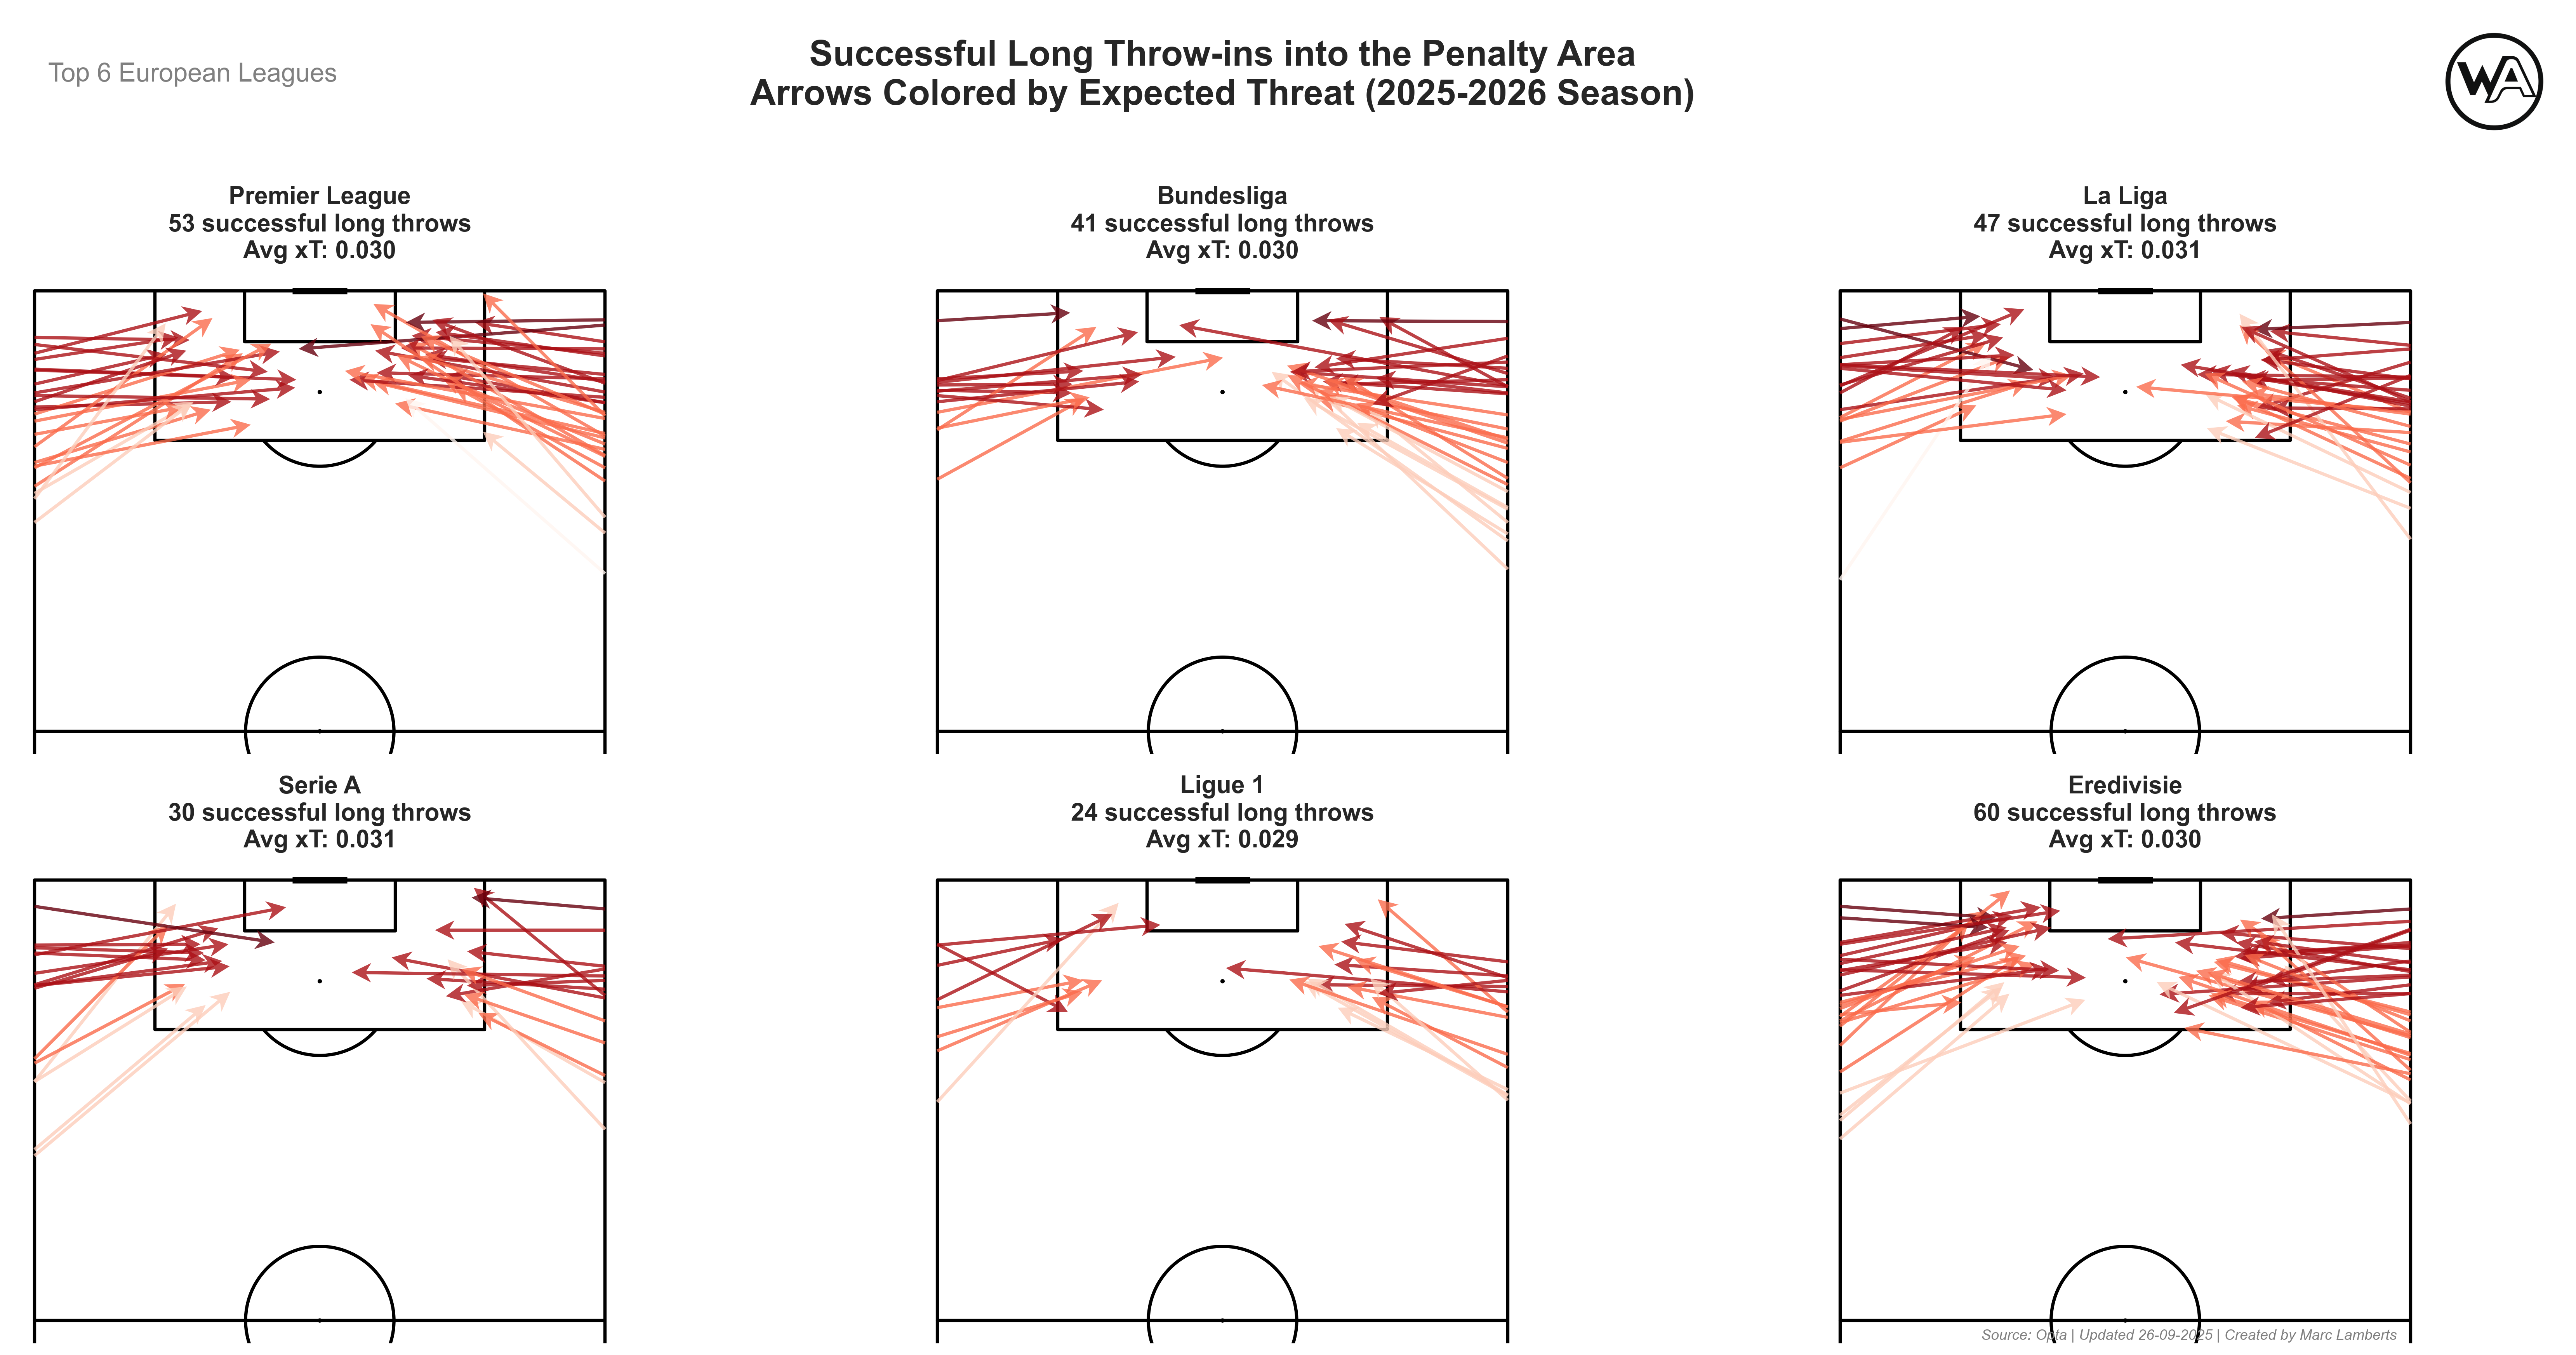
Let’s first have a look at the throw-ins:
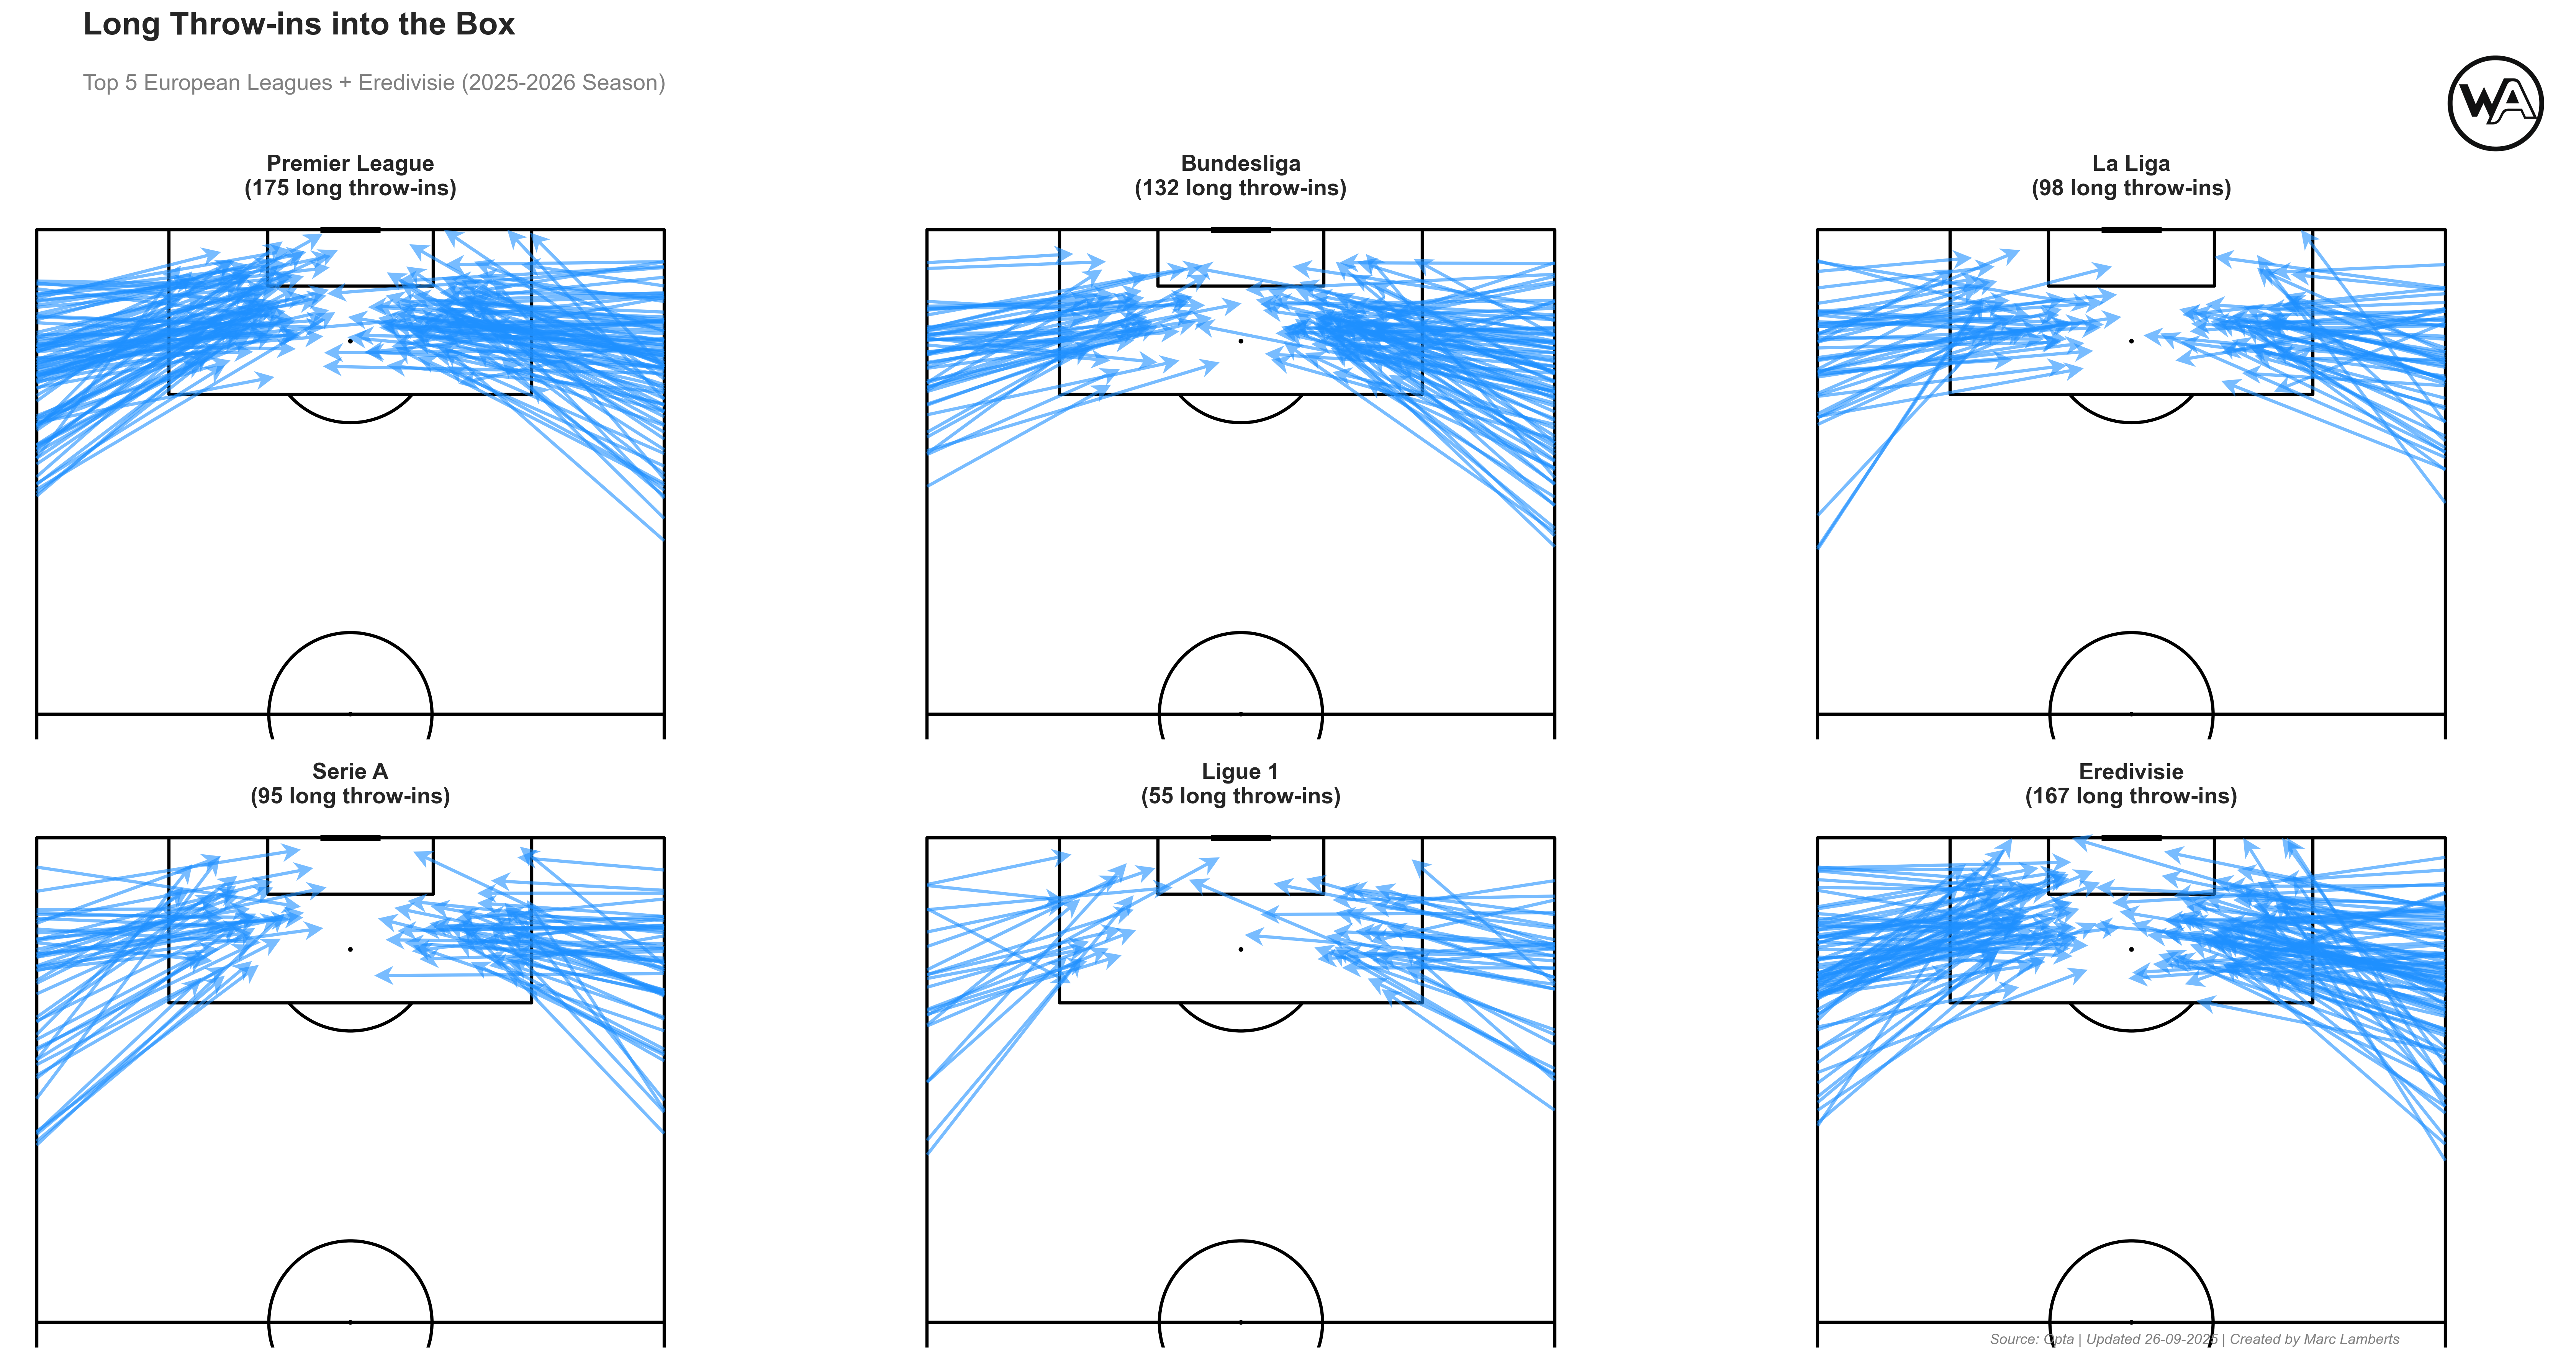
In the image above, you can see how many long throw-ins every league has so far. The Premier League has the most, followed by the Eredivisie and the Bundesliga. La Liga and Serie A are in the middle, with Ligue 1 definitely not choosing to do many long throw-ins.
It seems that the starting location do seem to be similar, let’s have a closer look to the starting locations, which are the x,y coordinates.
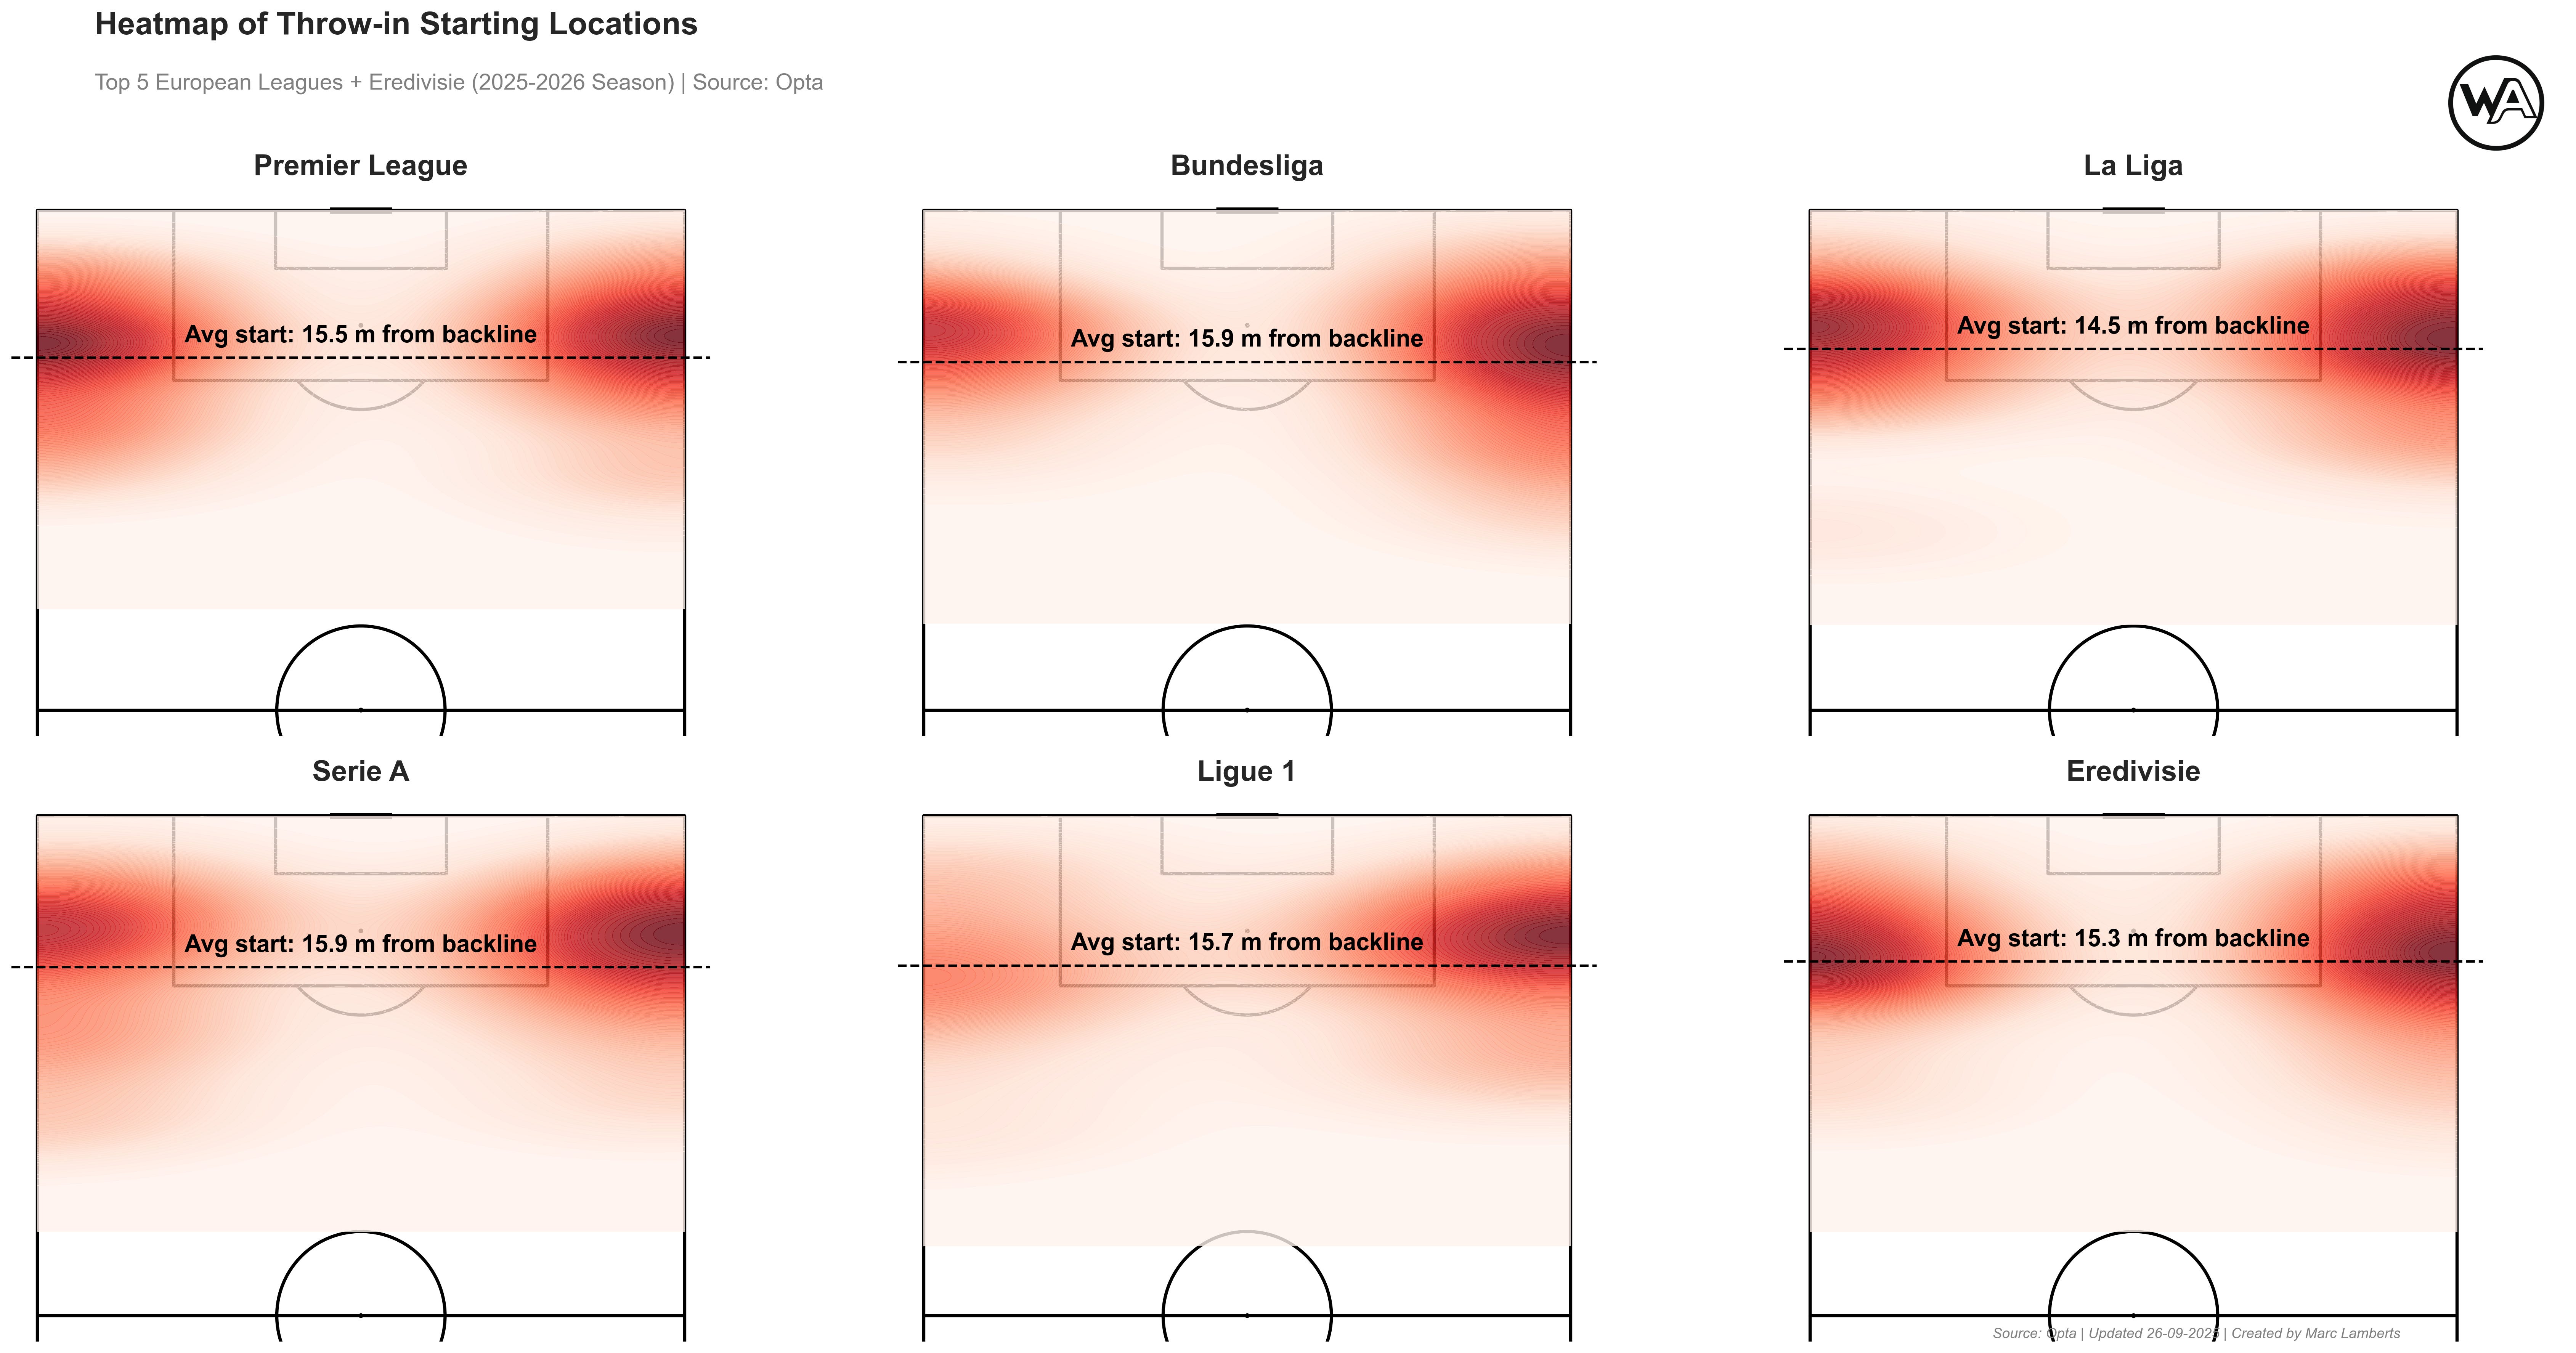
What we can see from the heatmap and the average start of the long throw-in locations is not groundbreaking, to be fair. All leagues bar one start their long throw-ins between 15.3 meters and 15.9 meters. Bar one. La Liga starts its long throw-ins much closer on average, with 14.5 meters from the backline.
But now obviously the thing we came her for – at least in this section of the article – the end locations. Where do these long throw-ins end?
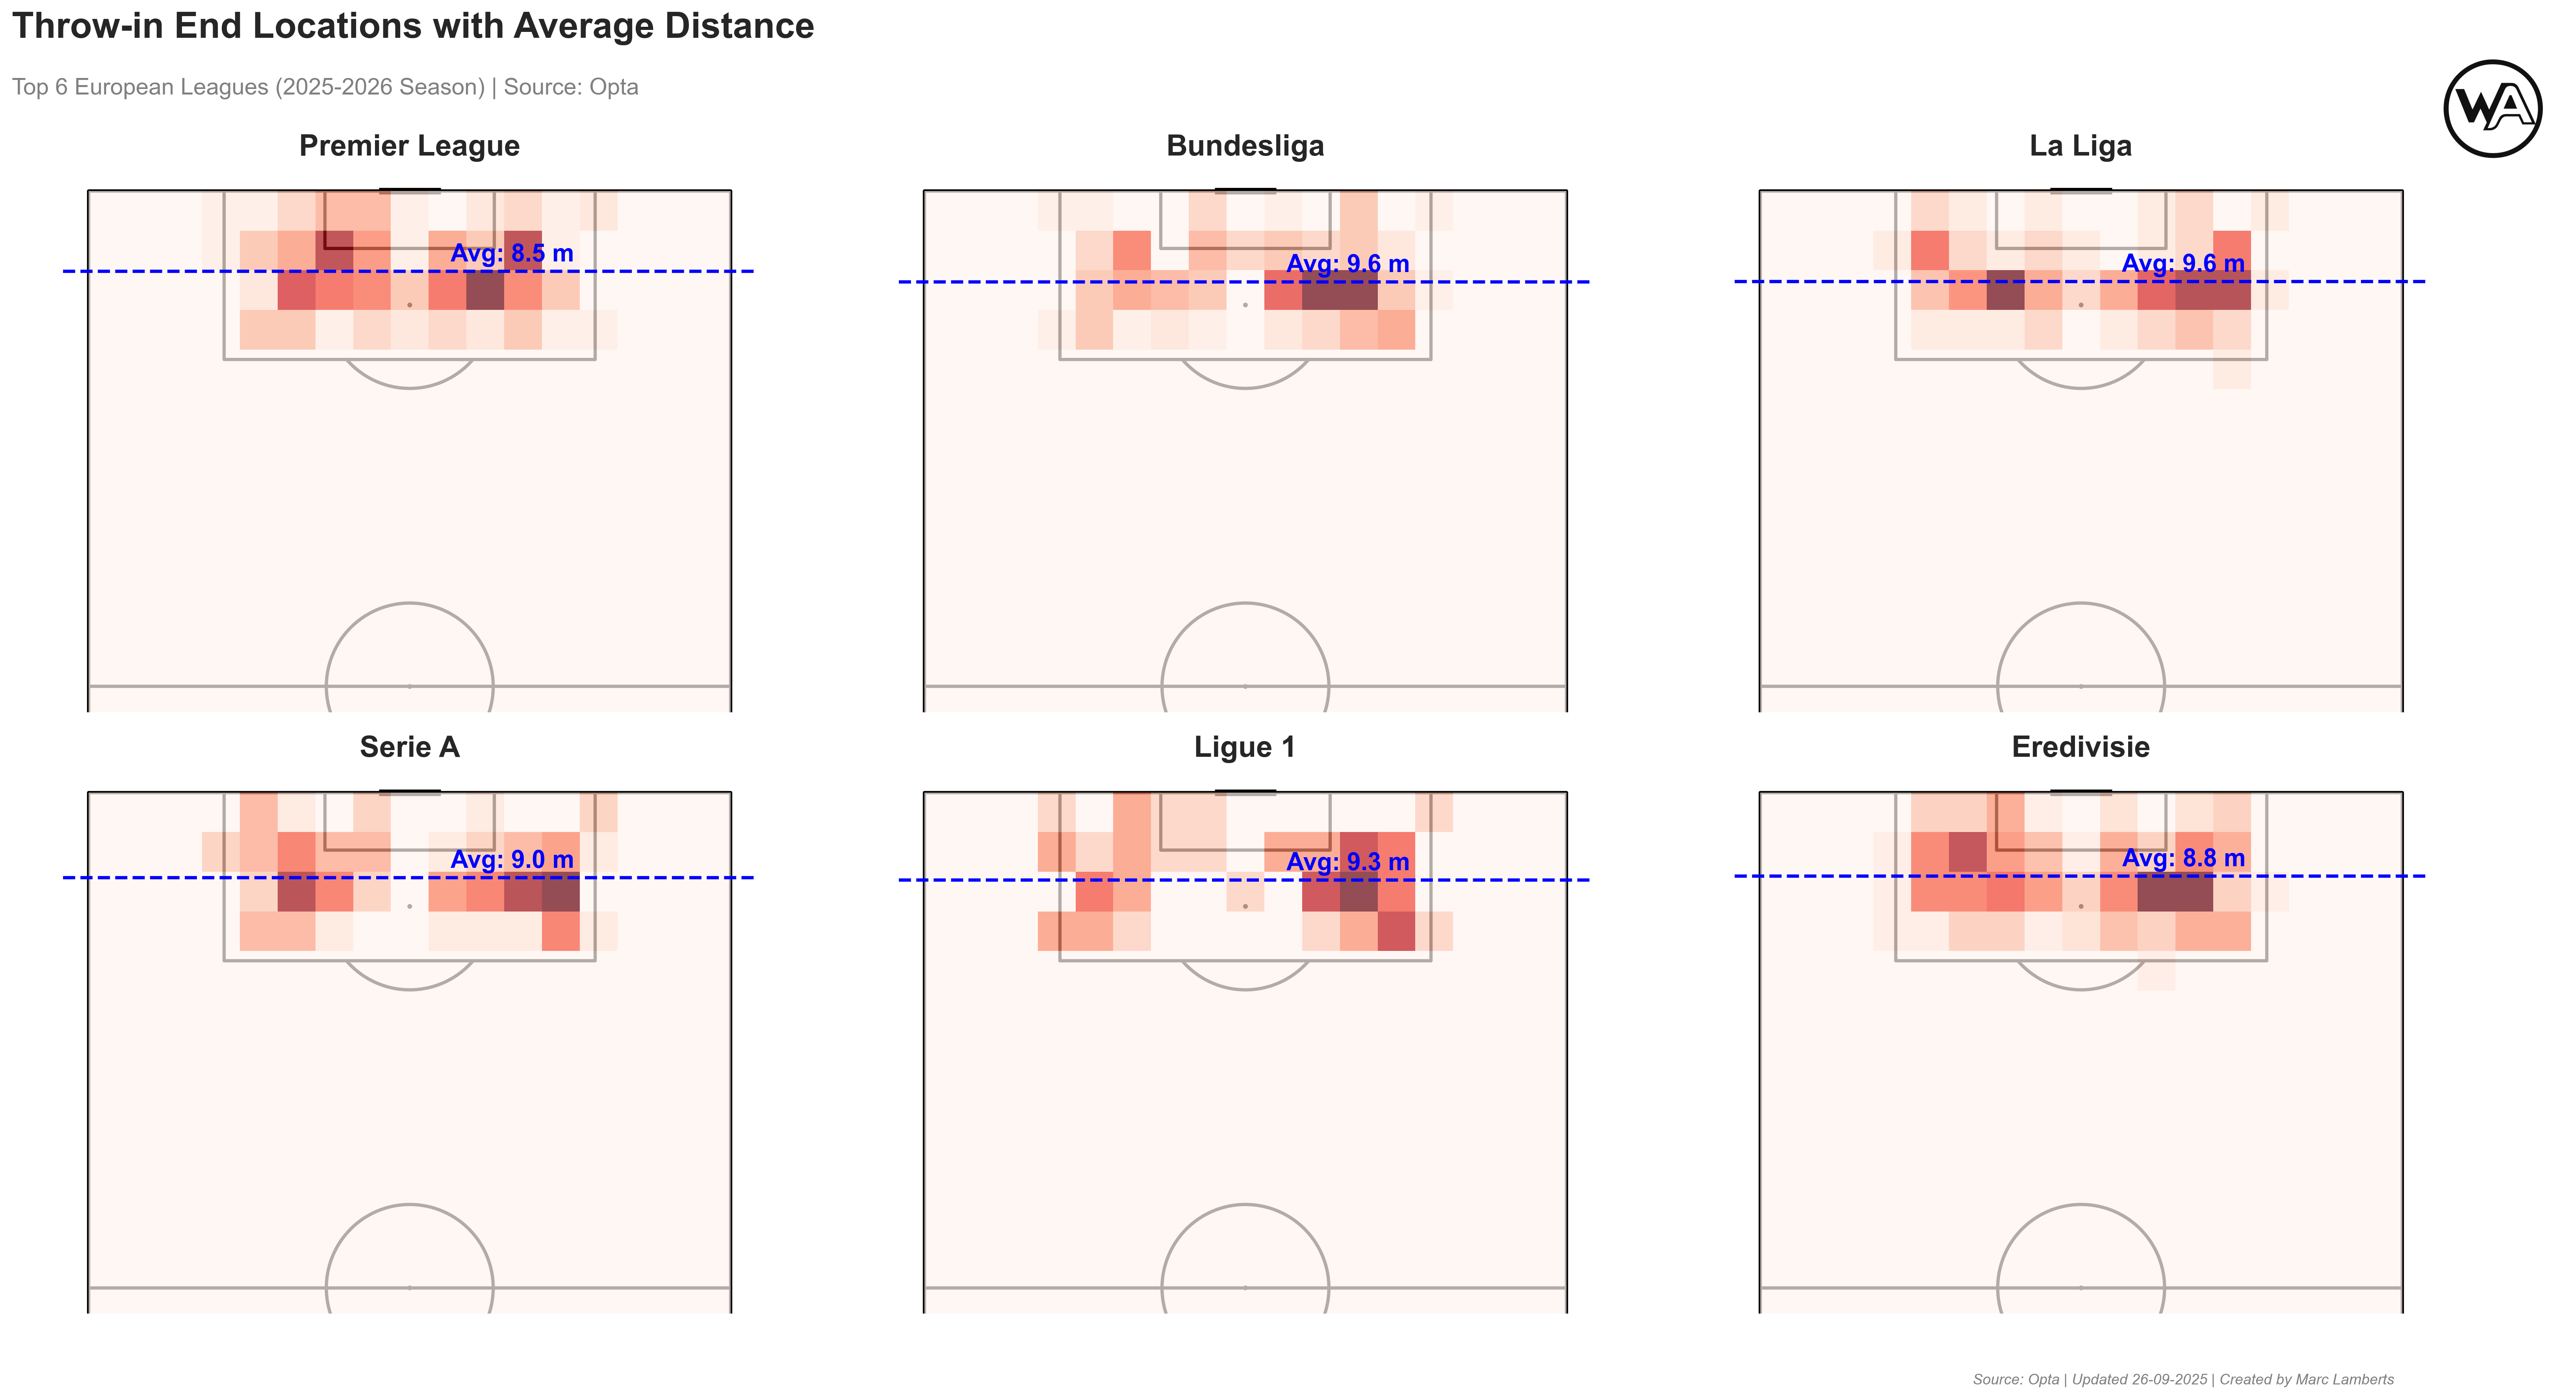
So, here we go. The Premier League has an average end location of 8,5 meter from the goal, which is the closest of them all. Eredivisie follows and then Serie A, Ligue 1, Bundesliga and La Liga.
In terms of development, the Premier League is very interesting. They come closest to the goal, which indicates that they throw the longest on average. But we can measure that too, of course.
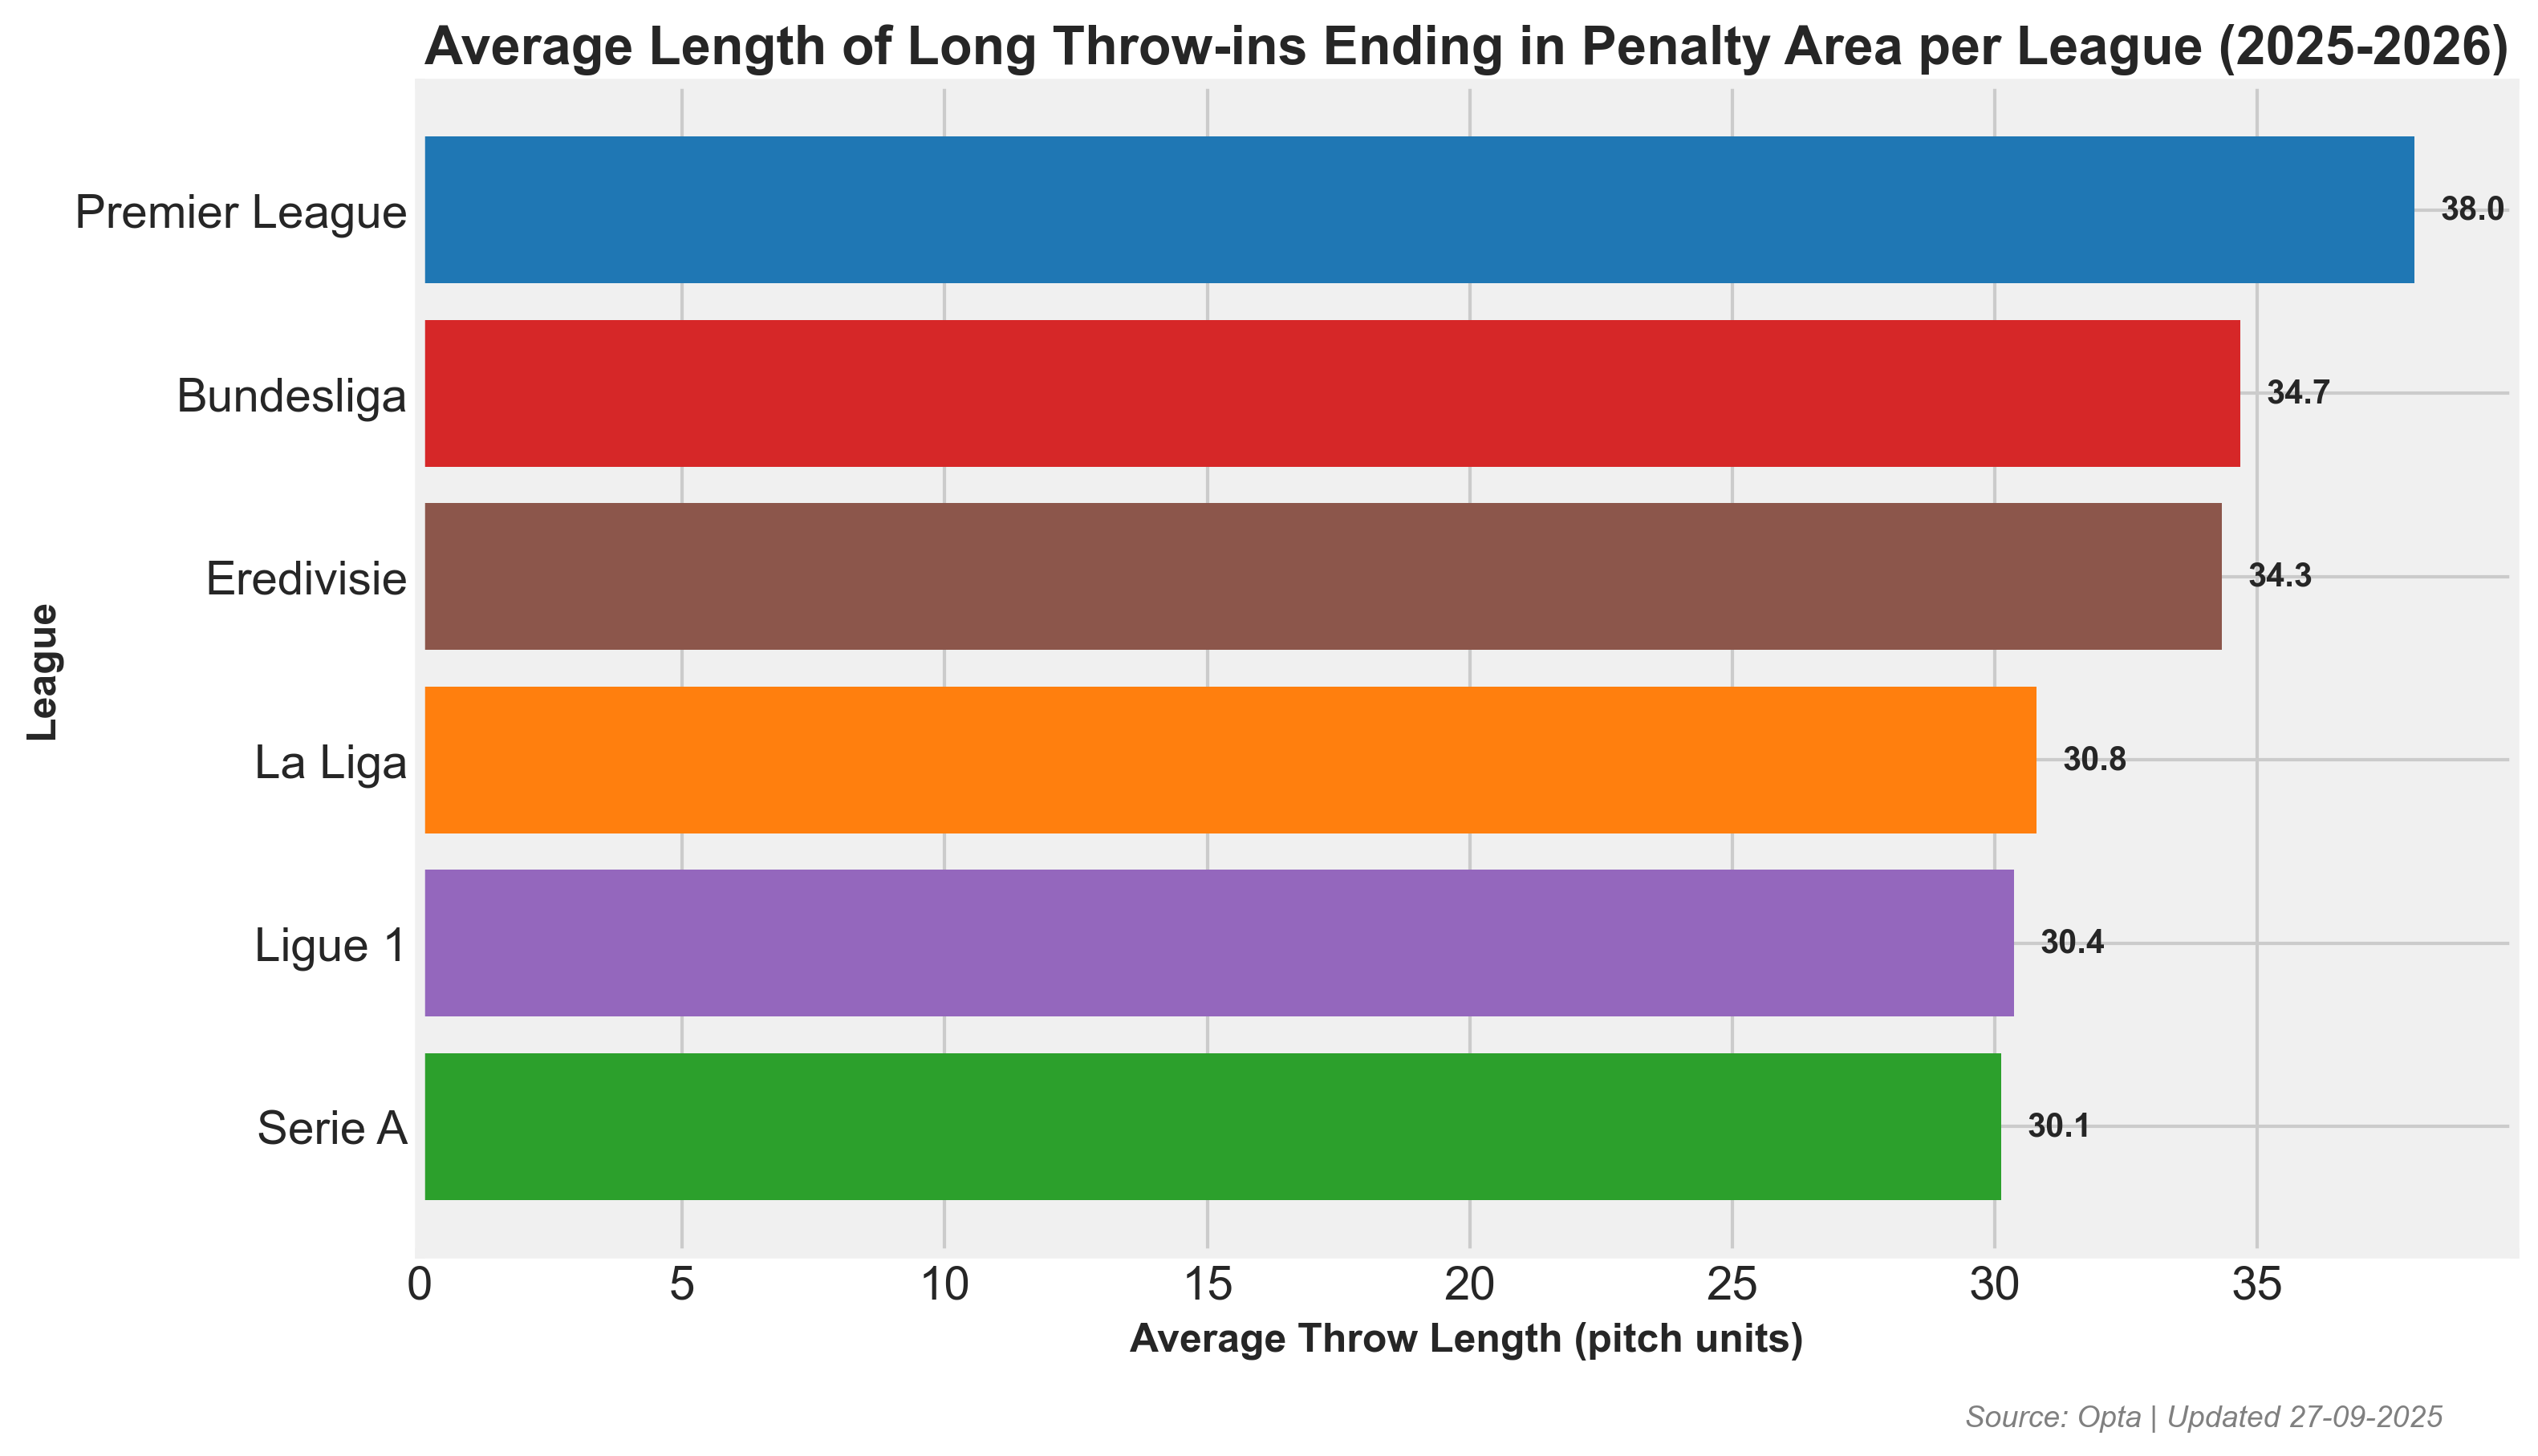
As you can see the longest throw-ins happen in the Premier League, followed by Eredivisie and Bundesliga. The average length is quite high during this season, which is a signal that there are developments in that regard.
Which value do long throws have?
Next step is of course, looking at the value of those throws. We have looked at where throws are started and where they ended, but the value on pitch is a different matter. We want to see what we actually can achieve with those long throw-ins. First we need to have a look at the success percentage.
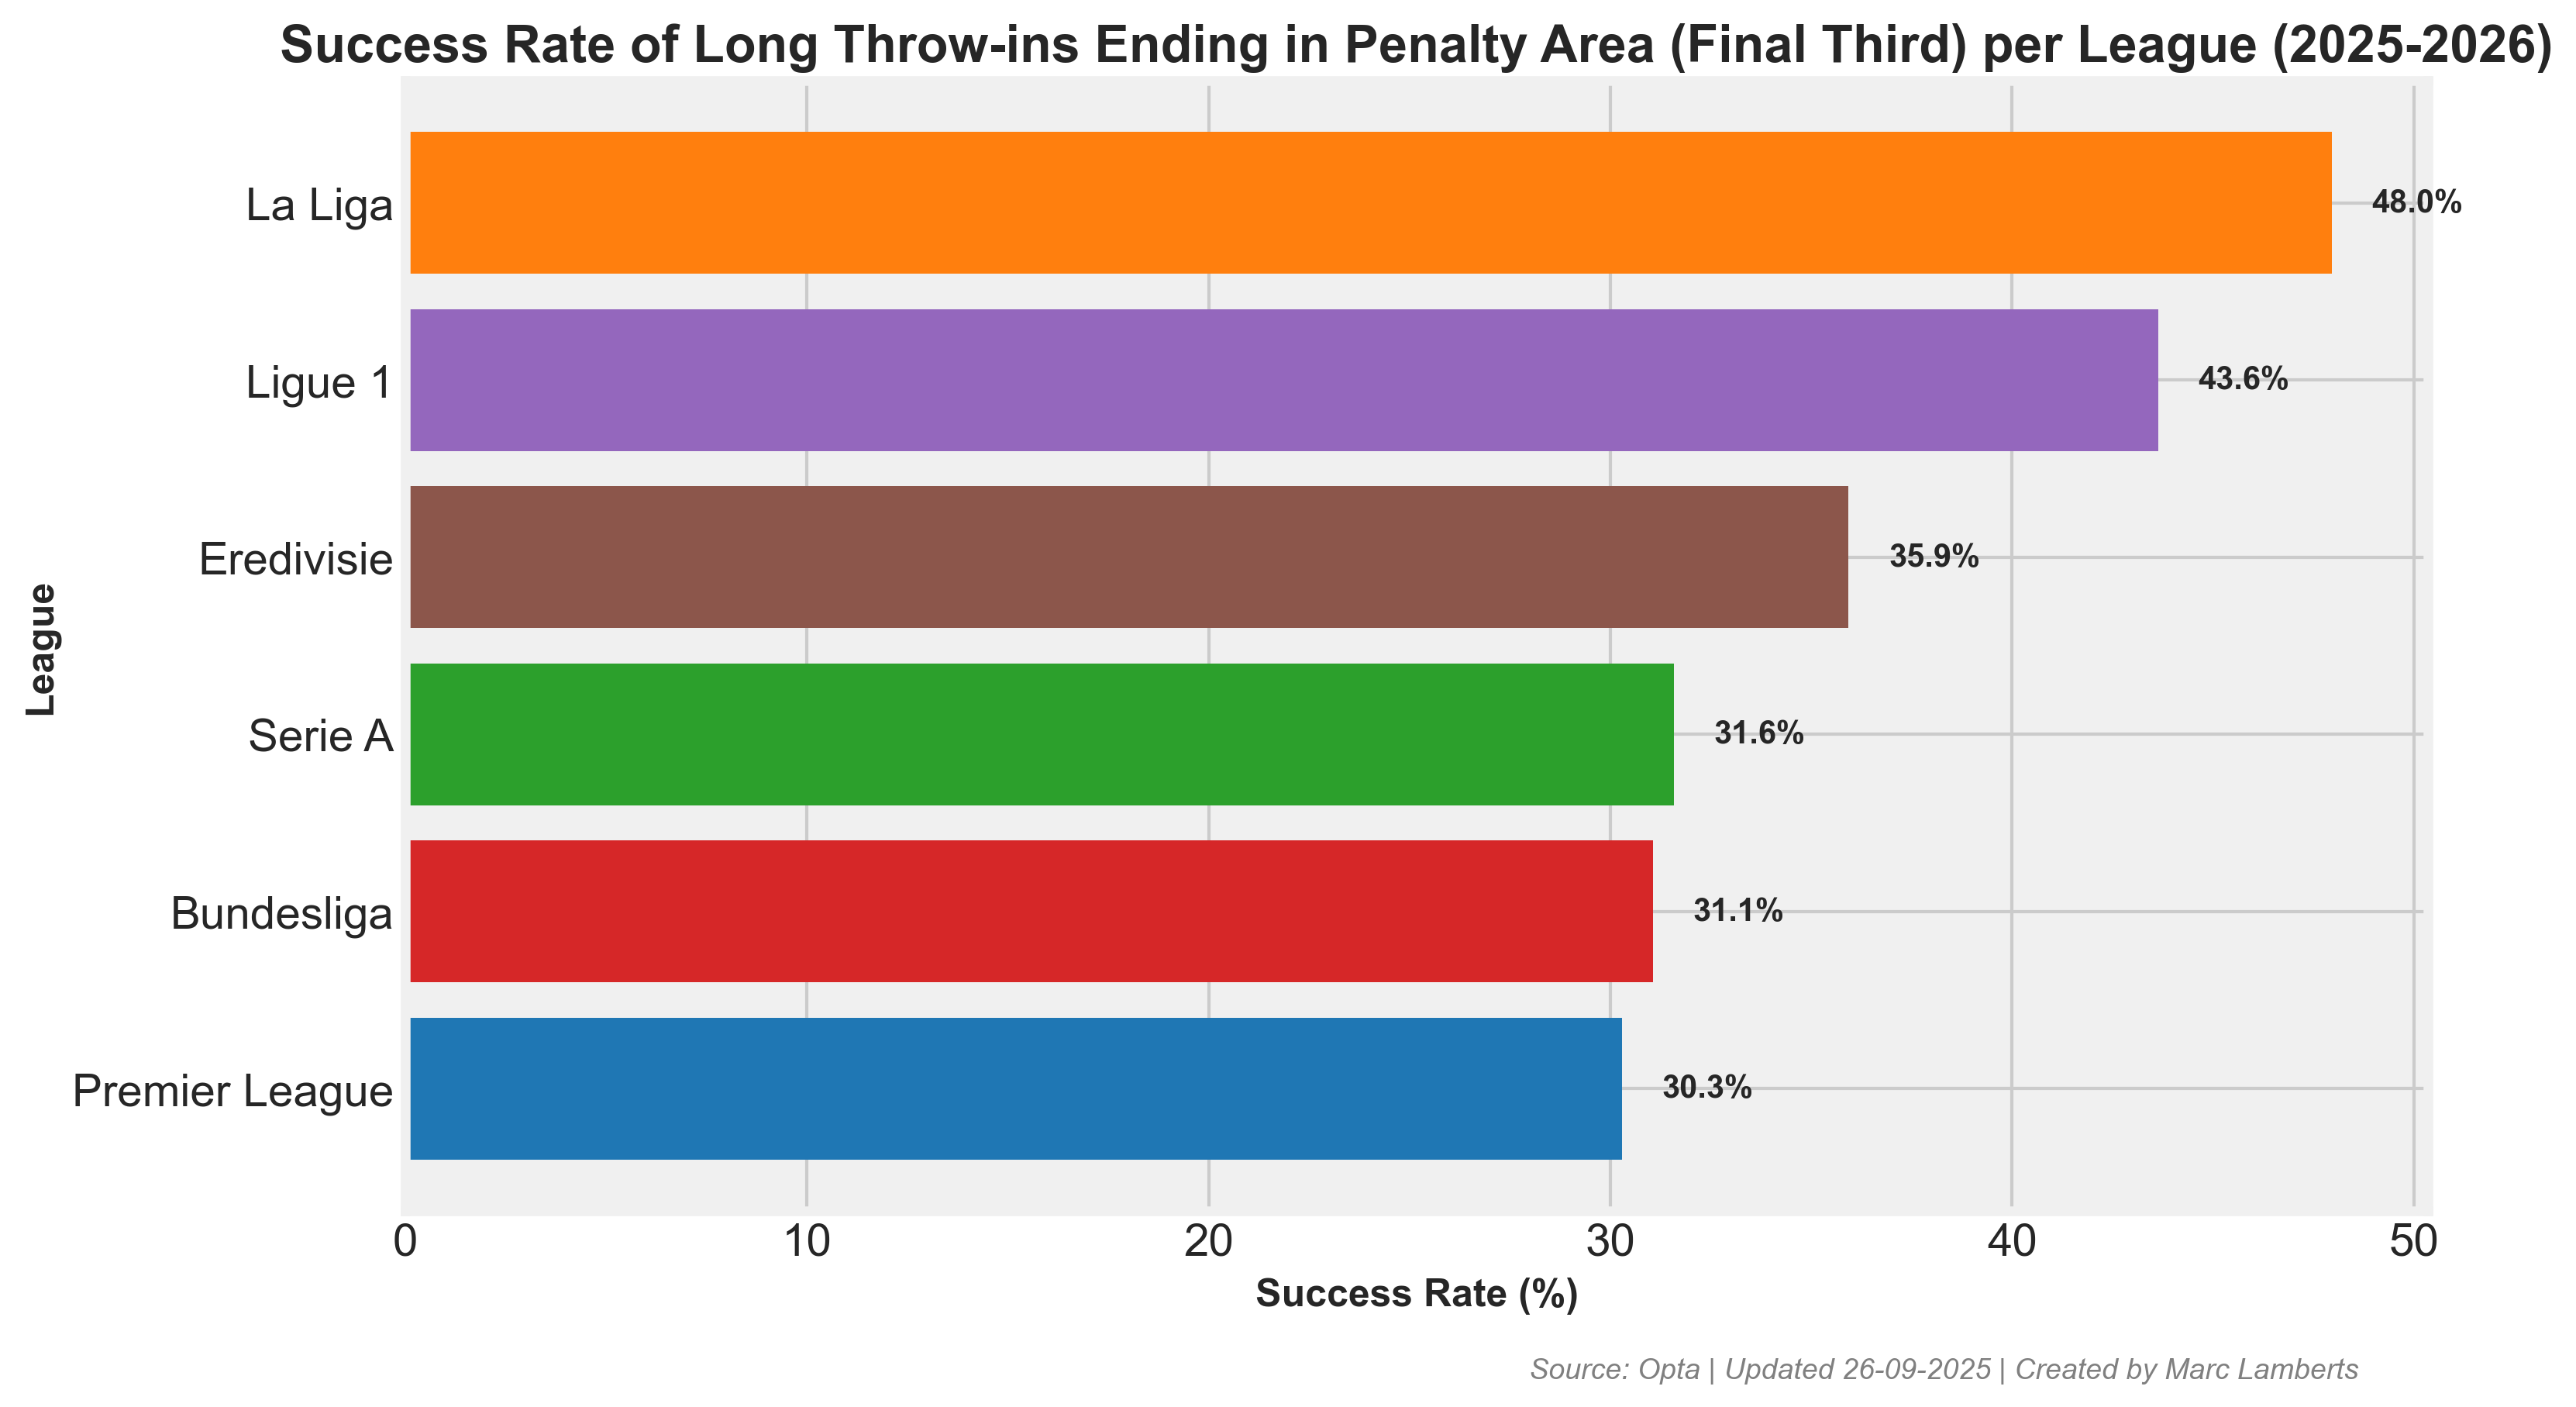
As you can see, some of the success rates do not completely align with the leagues that employ the most long throws, but that also makes sense, because they try more. We can see this in a better light in this scatterplot:
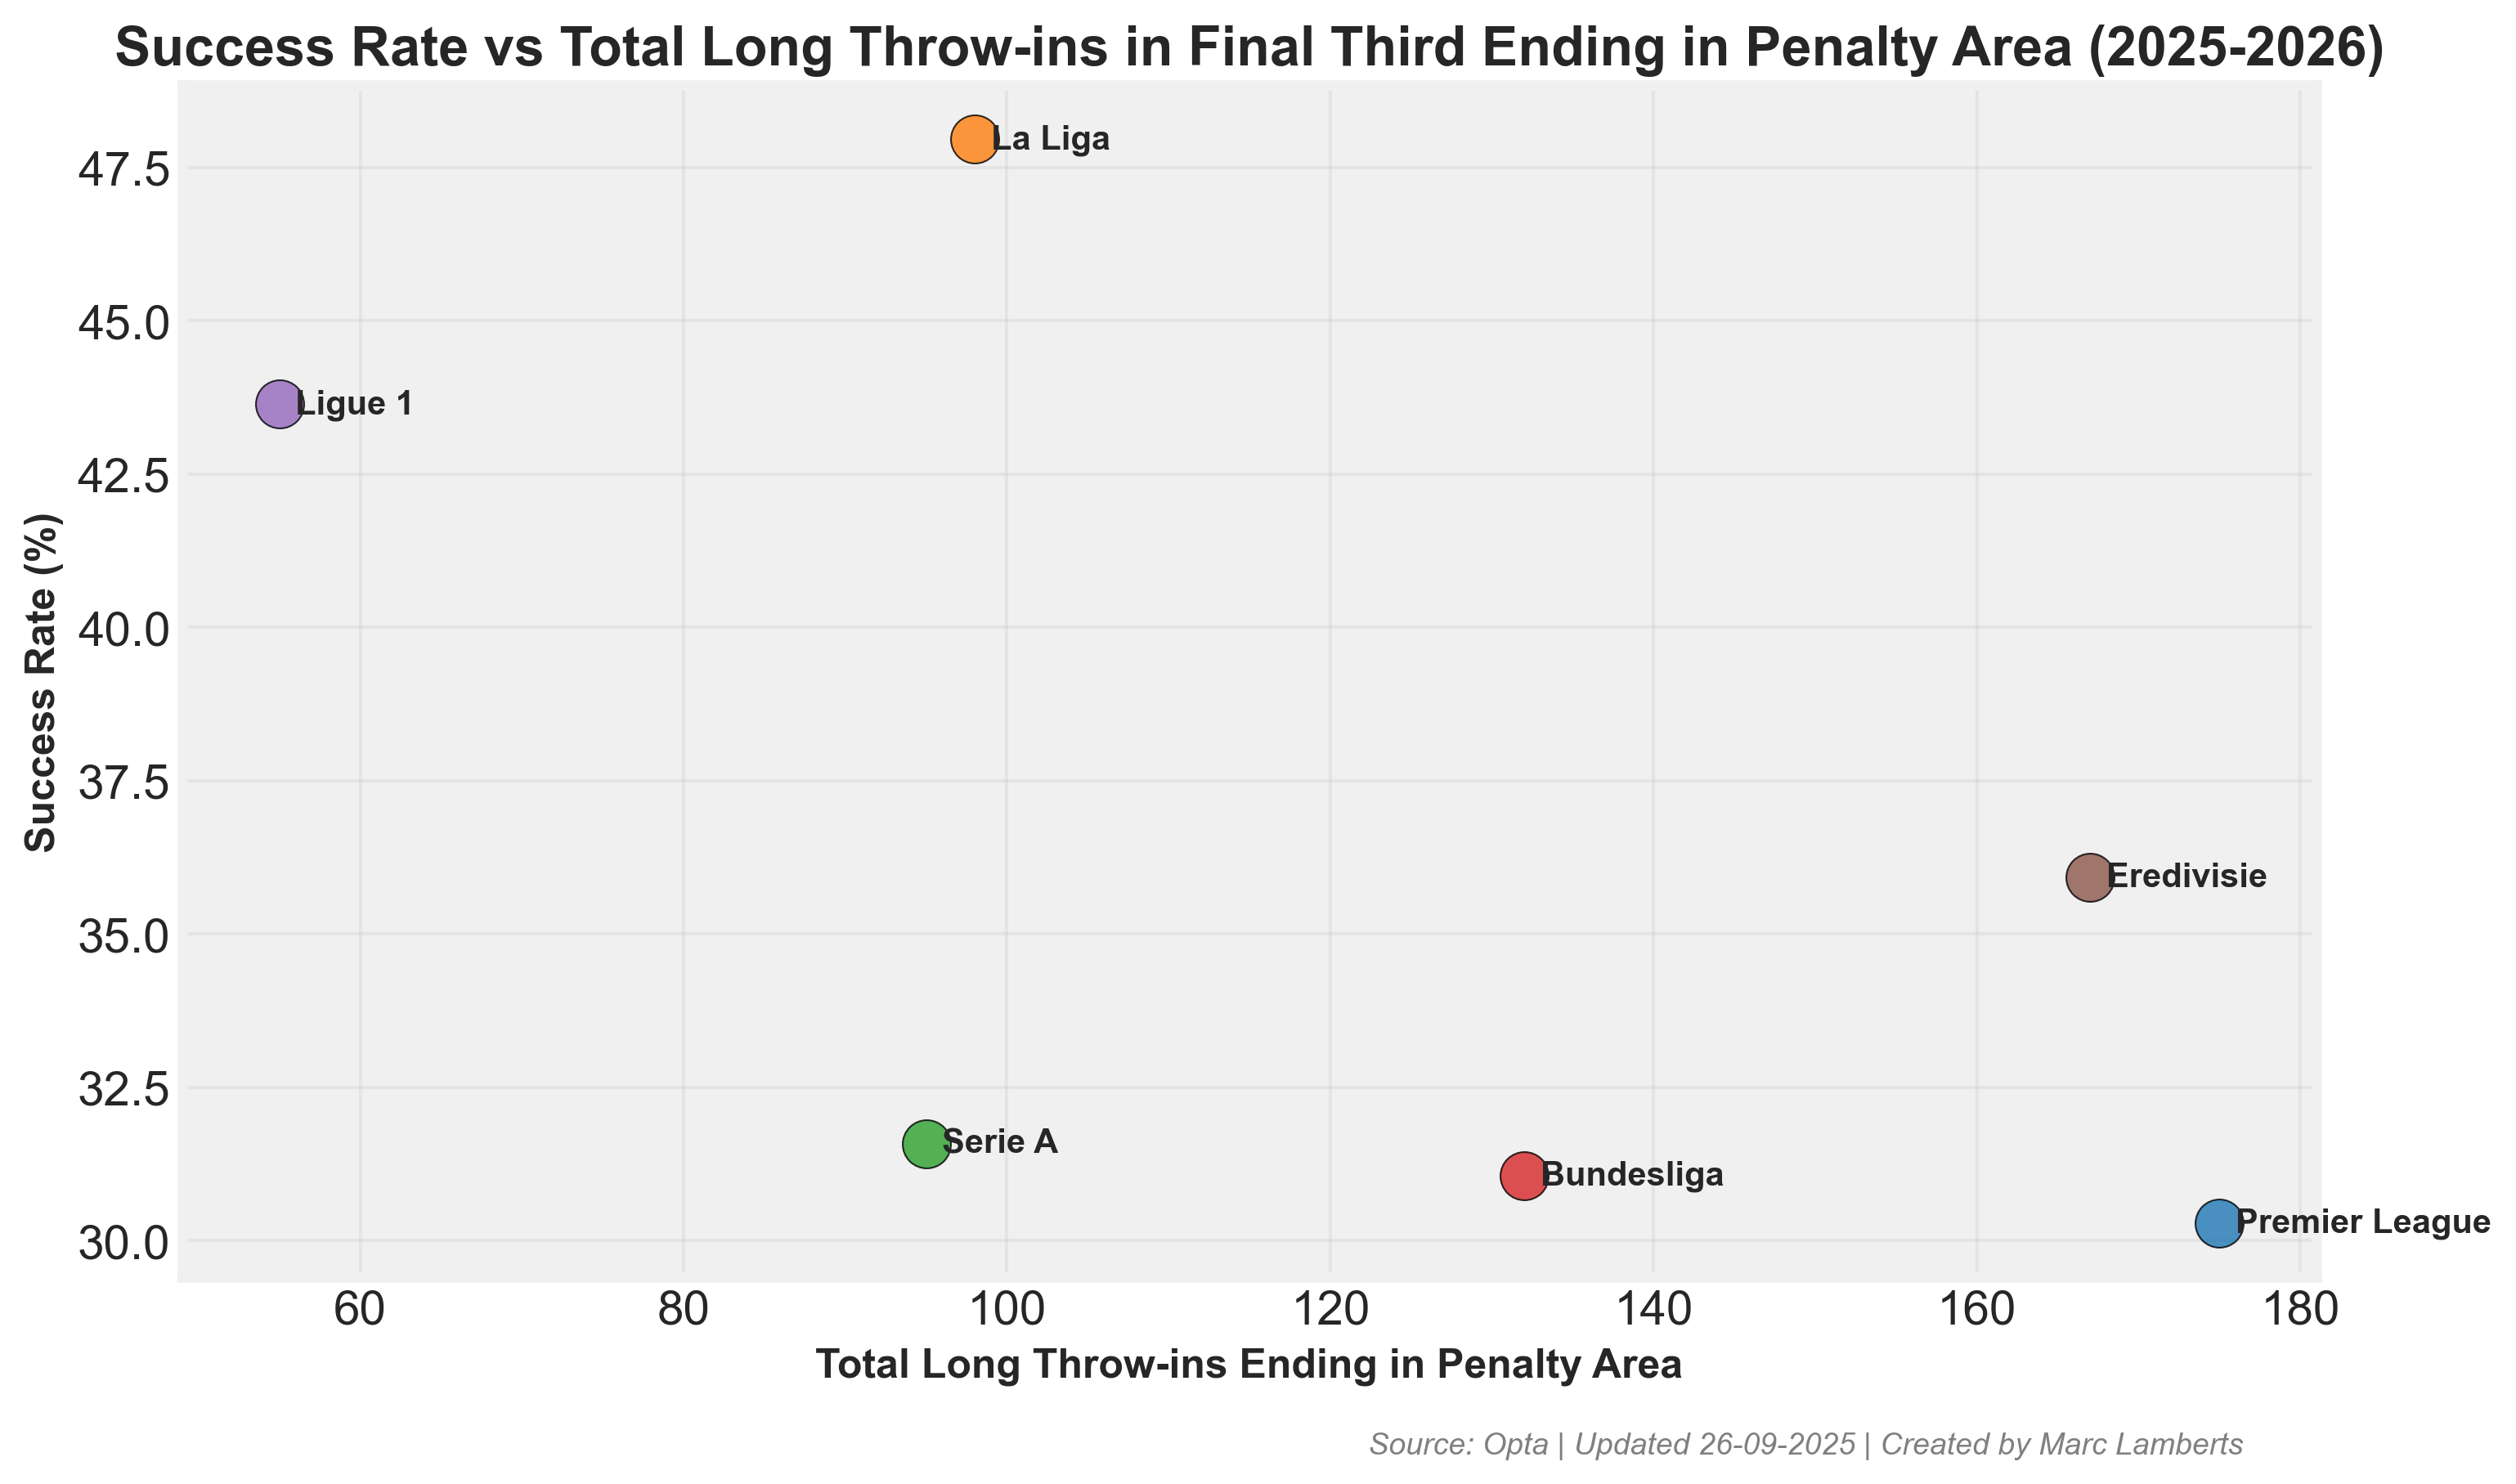
The higher the volume of long throw-ins, the lower the percentage of succes is, which isn’t that weird if we think about. Especially if we see that the top 3 leagues in volume, also tend to have the longest throw-ins with being the closest to goal.
Now the next step is, how do we add value from the successful attempts and evaluate them. In other words, how much threat do these long throw-ins generate? We will have a look at Expected Threat (xT).
The basic idea behind xT is to divide the pitch into a grid, with each cell assigned a probability of an action initiated there to result in a goal in the next N actions. This approach allows us to value not only parts of the pitch from which scoring directly is more likely, but also those from which an assist is most likely to happen. Actions that move the ball, such as passes and dribbles (also referred to as ball carries), can then be valued based solely on their start and end points, by taking the difference in xT between the start and end cell. In the case of Grealish, his ball carry brought a 0.013 xT increase, and the pass added a further 0.26 xT. In short, he moved the ball from a low-xT cell (0.02 xT) to a much more dangerous area of the pitch (0.32 xT). Note that the xT action value can be negative for passes and carries that move the ball away from goal. – Soccerments
In the image above, we can see how each league deals with their successful long throw-ins. What’s interesting is that Serie A and La Liga have the highest average xT per throw-in of 0,031 xT, while Eredivisie, Bundesliga and Premier League have 0,030 xT but they have more successful long throw-ins. This gives us the idea that the quality and intention from the latter three is higher.
Teams: which teams stand out?
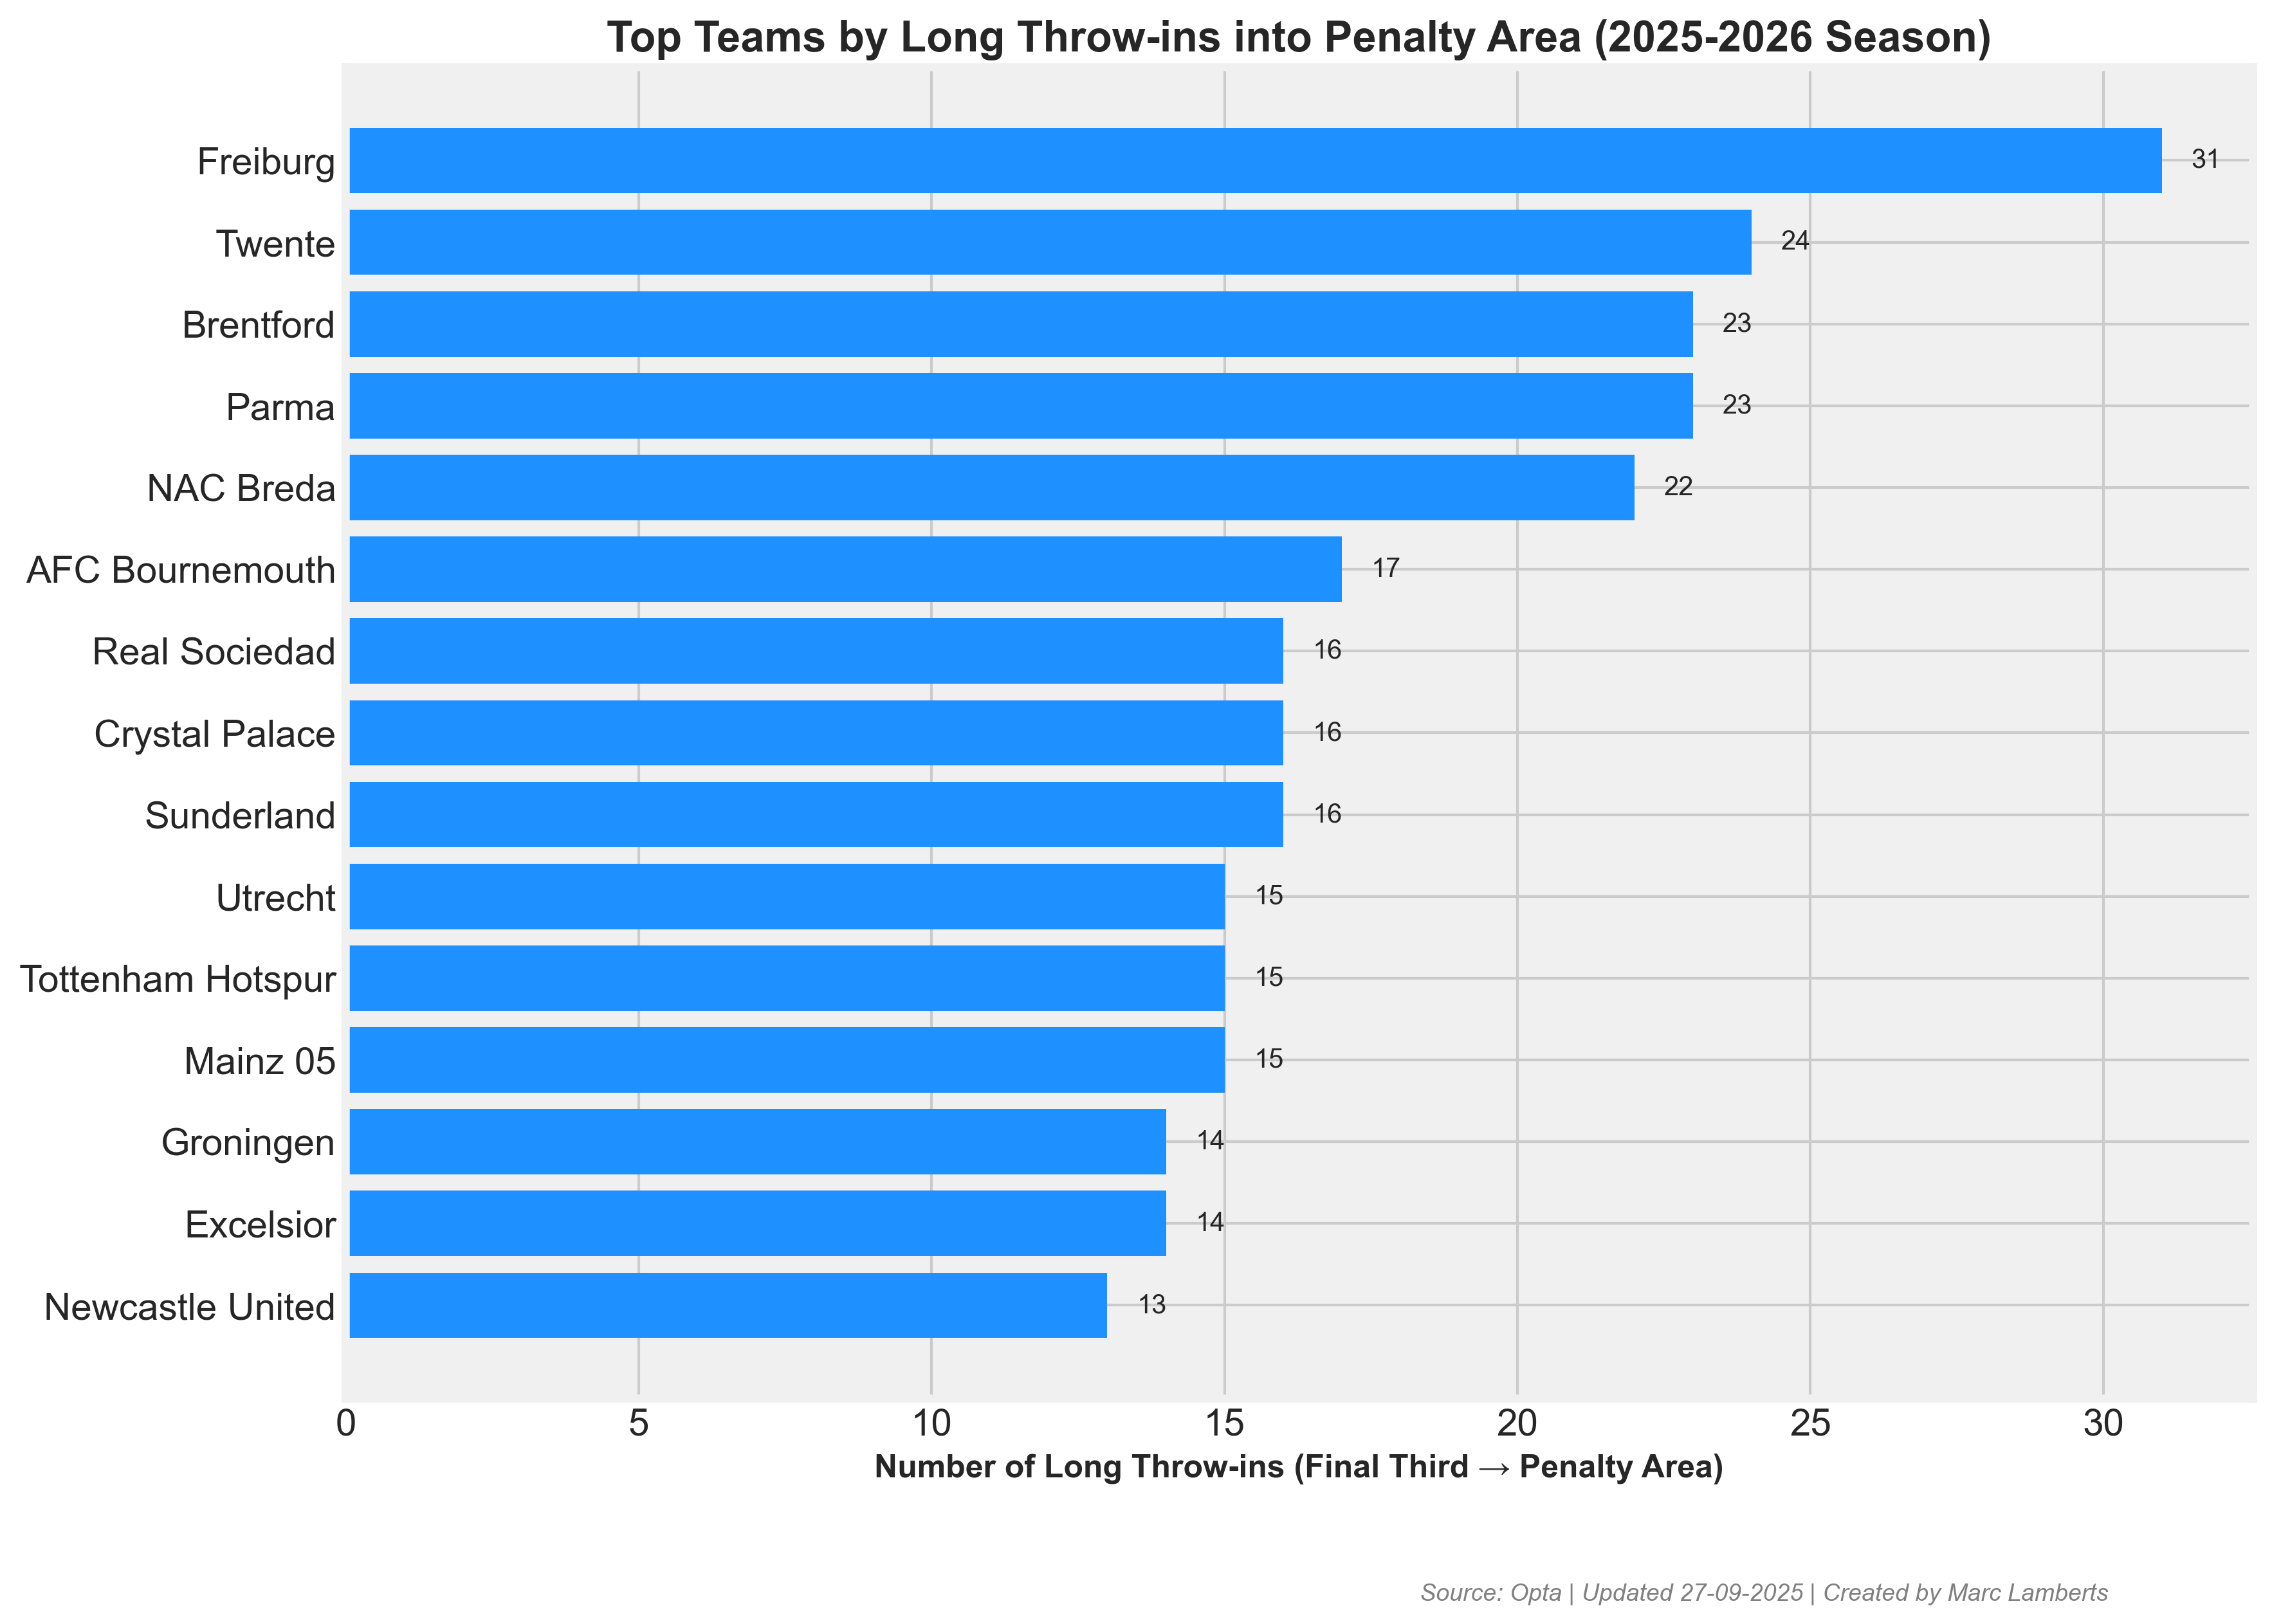
If we look at the best 15 teams in the number of long throw, we can see that Freiburg, FC Twente and Brentford are the best 3 teams in terms of volume. Parma, NAC Breda and Bournemouth also score high.
Let’s move now to the teams who create the most value out of the long throw-ins, which means the xT from successful throw-ins.
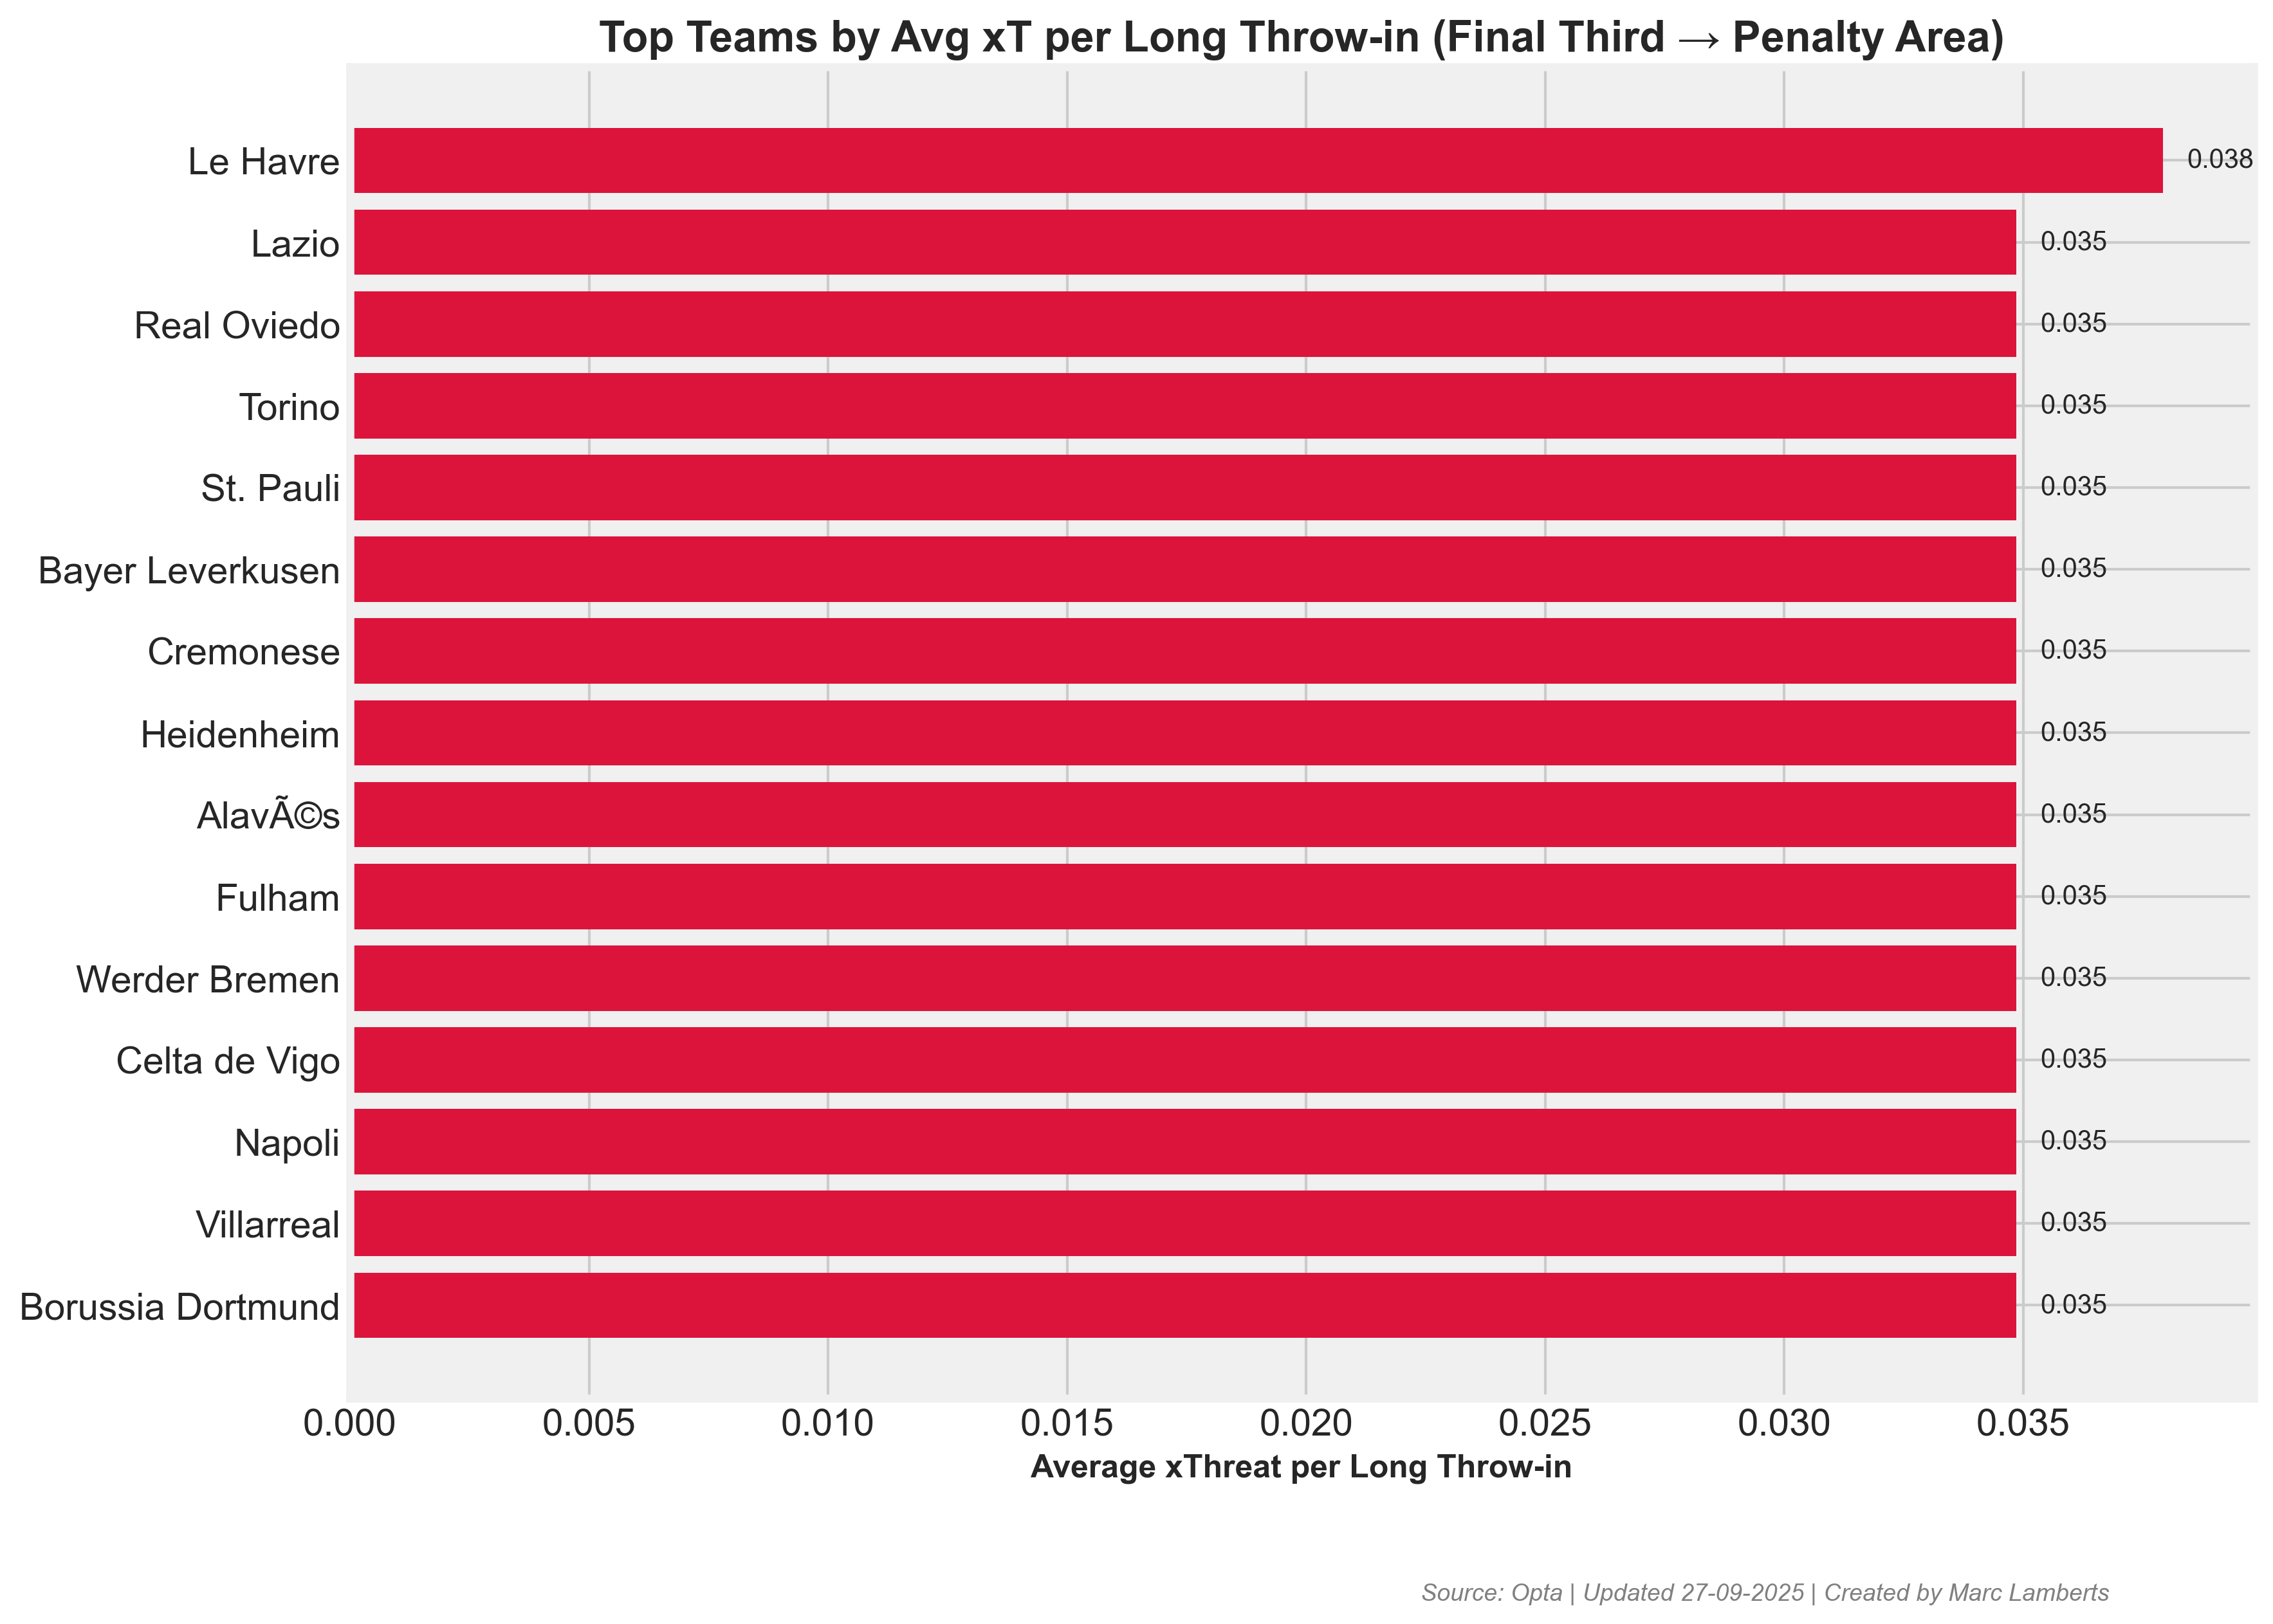
First of all, it’s good to notice/acknowledge that many teams might have the same xT. As we can see Ligue 1’s Le Havre has the highest value, followed by Lazio, Real Oviedo and Torino.
We can combine this into a scatterplot to see the volume of throw-ins and the xT of the throw-ins.
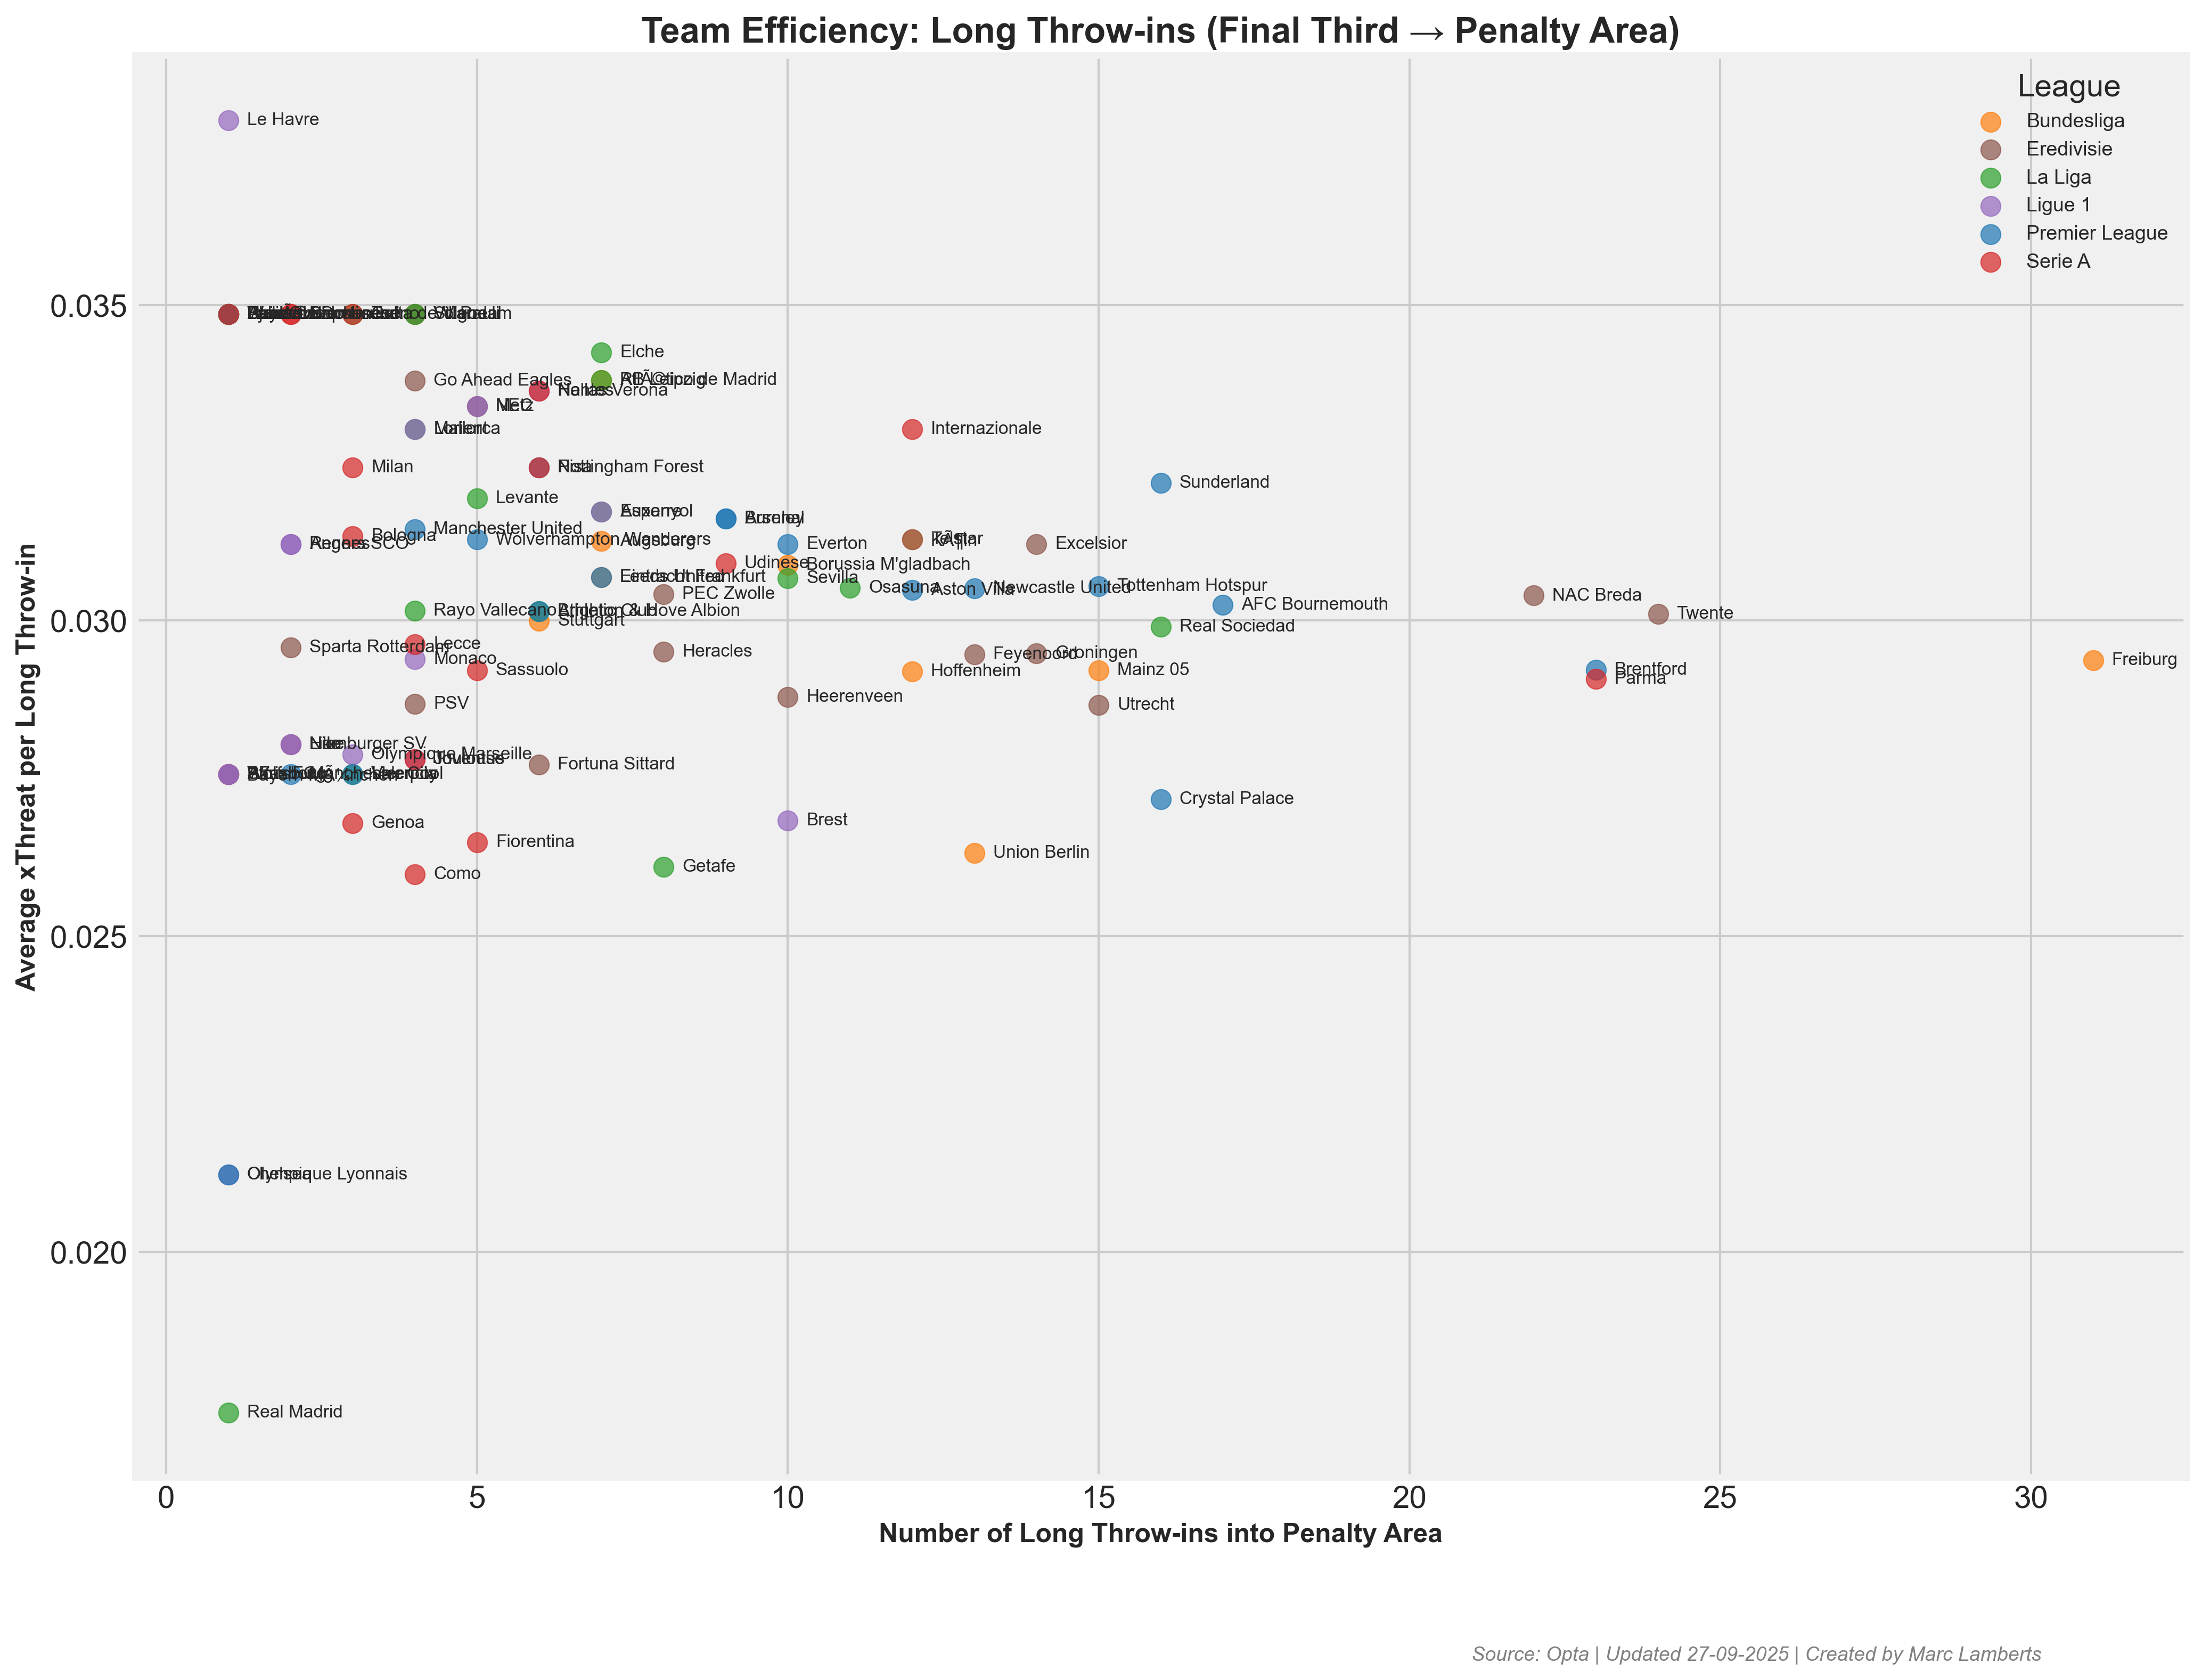
We see that many teams have had a few successful throw-ins into the final third, mostly between 0 and 10, with the average expected threat being between 0.025 and 0.035.
Outliers here Le Havre with a high average xT per throw-in, however, they have had under 5 throw-ins, so that result should be taken with less representation. On the other end, teams like Freiburg, Brentford, Parma, FC Twente and NAC Breda have had many long throw-ins with success, and around 0.030 xT on average. This is a sign that they keep their quality even with a higher volume.
Players
Just like teams, we can also add value to the players with that throw-in quality. First I want to look at the players who can throw the furthest in terms of length.
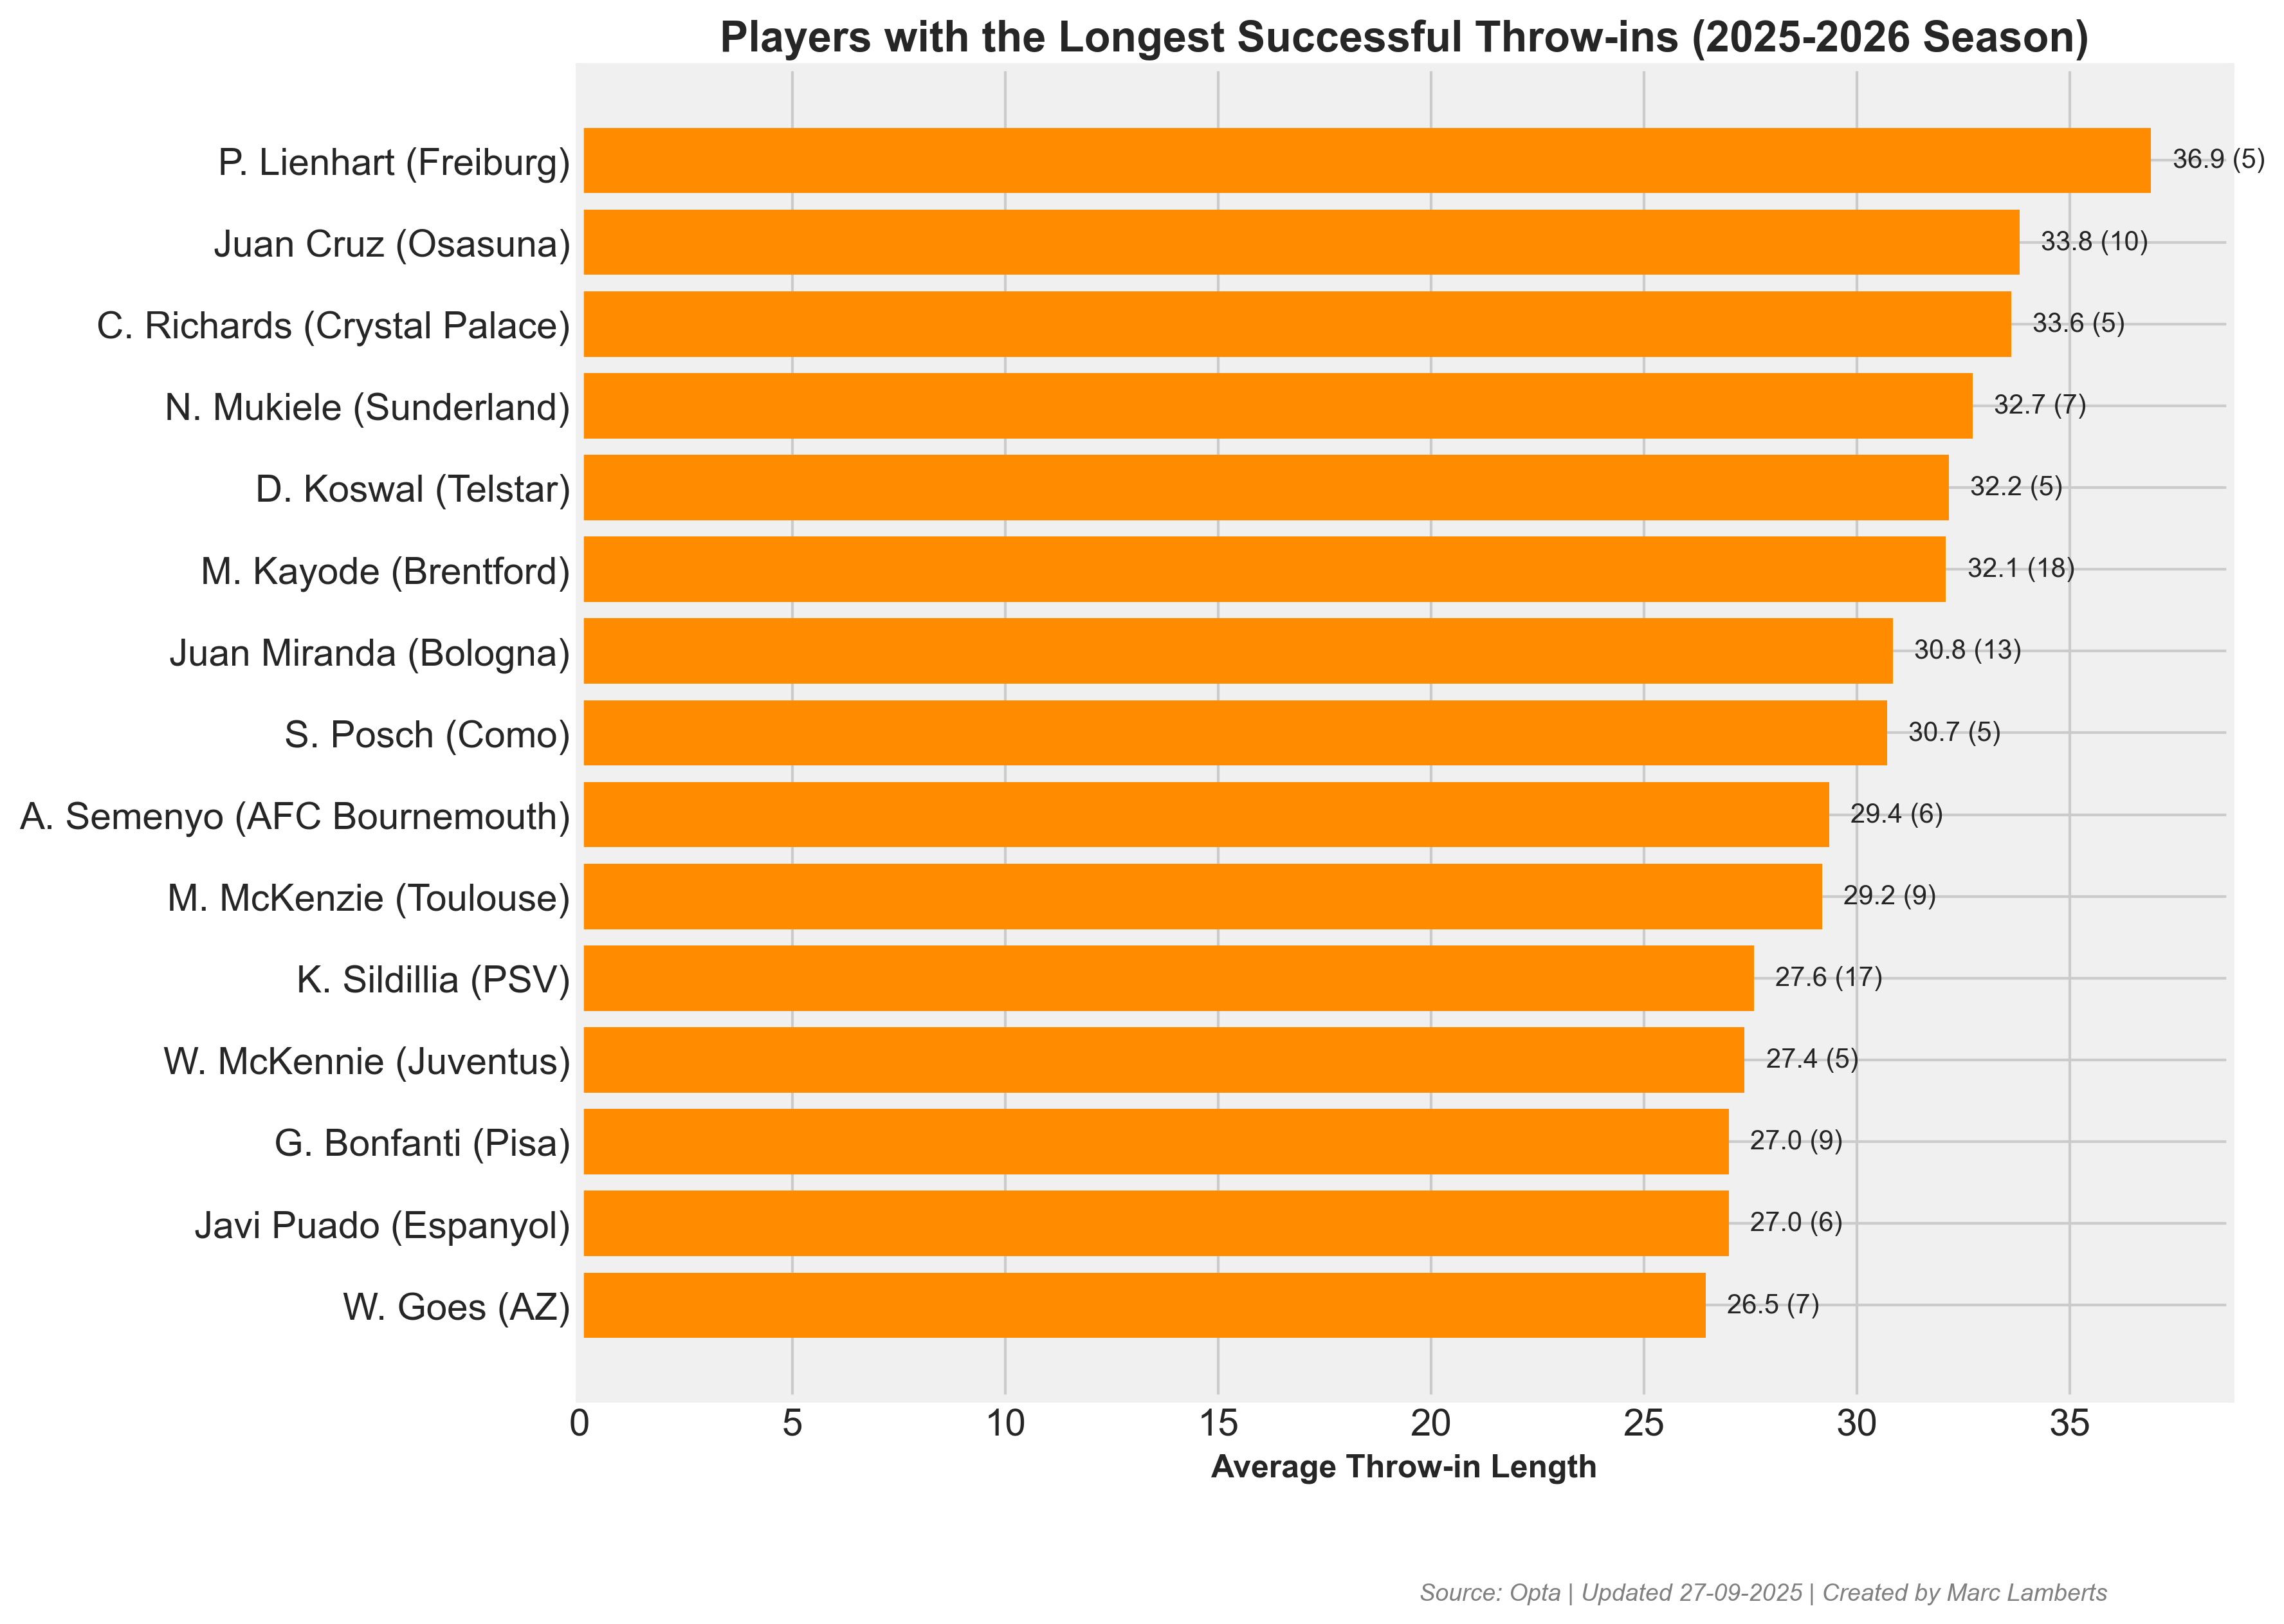
If we look at the average length of successful throw-ins, a few players really stand out. Lienhart, Cruz, Richard, Mukiele, Koswal and Kayode, really do make an impact with their length. This means that they can almost reach the penalty spot, and can lead to dangerous situations in front of goal.
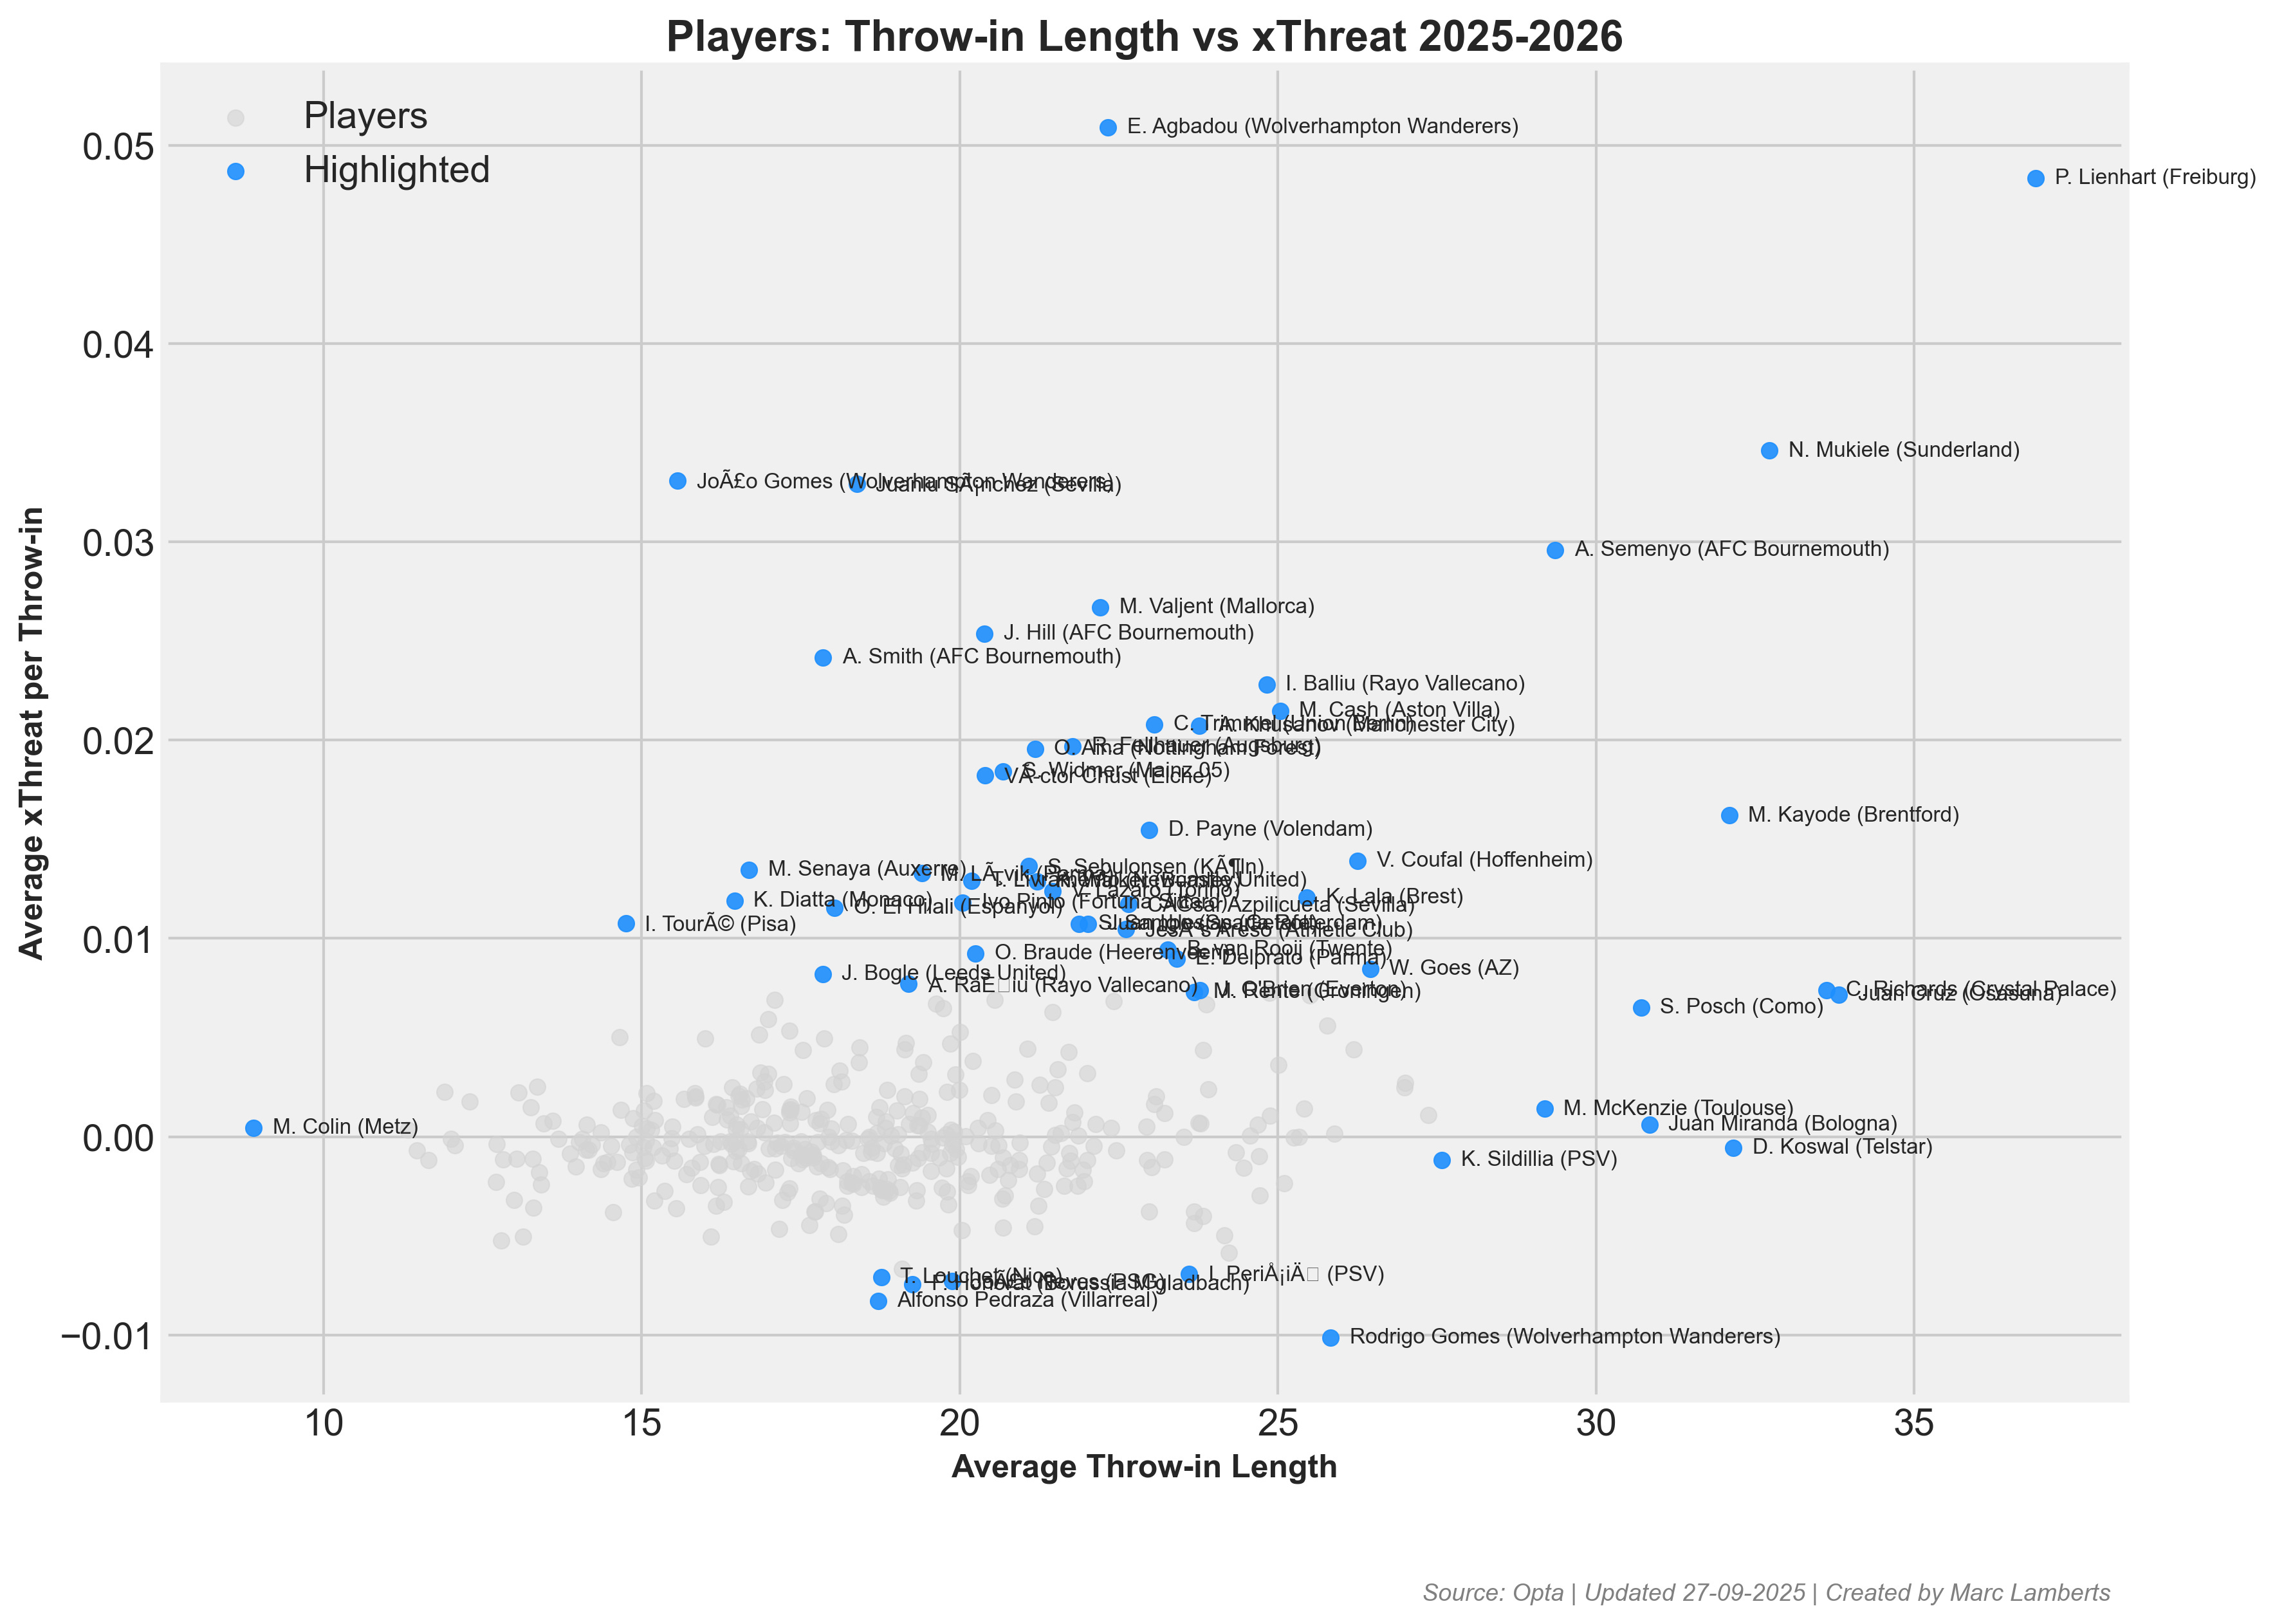
In the scatterplot above you can see the average throw-in length compared to the average xT value per throw-in. It’s important to see which players have a high average length and also a high xT per throw-in, which means that they are likely to add the most value to their long throw-ins.
Lienhart from Freiburg is the abolsute leader and most valuable, Mukiele (Sunderland) and Semenyo (Bournemouth) score high too.
Final thoughts
Long throw-ins remain one of football’s most overlooked set-pieces, yet this research shows they can be a meaningful attacking weapon. By filtering only successful throws from the final third into the penalty area, we see clear differences across leagues: some treat them as deliberate tactical tools, while others view them simply as restarts. Measuring not just volume but also xT reveals which teams genuinely create danger through this method.
At the team level, long throw frequency reflects identity — direct sides often lean on them, while possession-focused teams rarely do. At the player level, outliers emerge: some specialise in distance, others in placement, and a small group consistently generates high xT per throw. These individuals act as set-piece playmakers, using their arms rather than their feet.
Ultimately, this analysis highlights a low-cost but high-impact opportunity. For scouting, coaching, and opposition analysis alike, long throw-ins deserve far more attention than they usually receive.
Citation
admin. (2025, september 27). All’s Well That Ends Well… With a Long Throw-in. Waltzing Analytics. https://waltzinganalytics.com/2025/alls-well-that-ends-well-with-a-long-throw-in/