3.3 / Services / Data Engineering

Data Engineering: Model Pipelines

A worked example of the modelling and pipeline engineering behind the Data Engineering tile: five model families, each validated before it ships. A shot-quality Danger model built on xG, a cross-outcome model, a headed-clearance landing model, and the xT and shot-clock work (the model behind this article) structured as a Markov Decision Process and turned into a repeatable pipeline.

The validation detail below is deliberately unfiltered, so you can see exactly how rigorously each model was checked before it shipped. If you'd rather skip straight to what this means for your own data, jump to what this looks like as a service.

Pipeline scale

Four seasons of Eredivisie event data, loaded and re-parsed every time the models are retrained — not a one-off export.
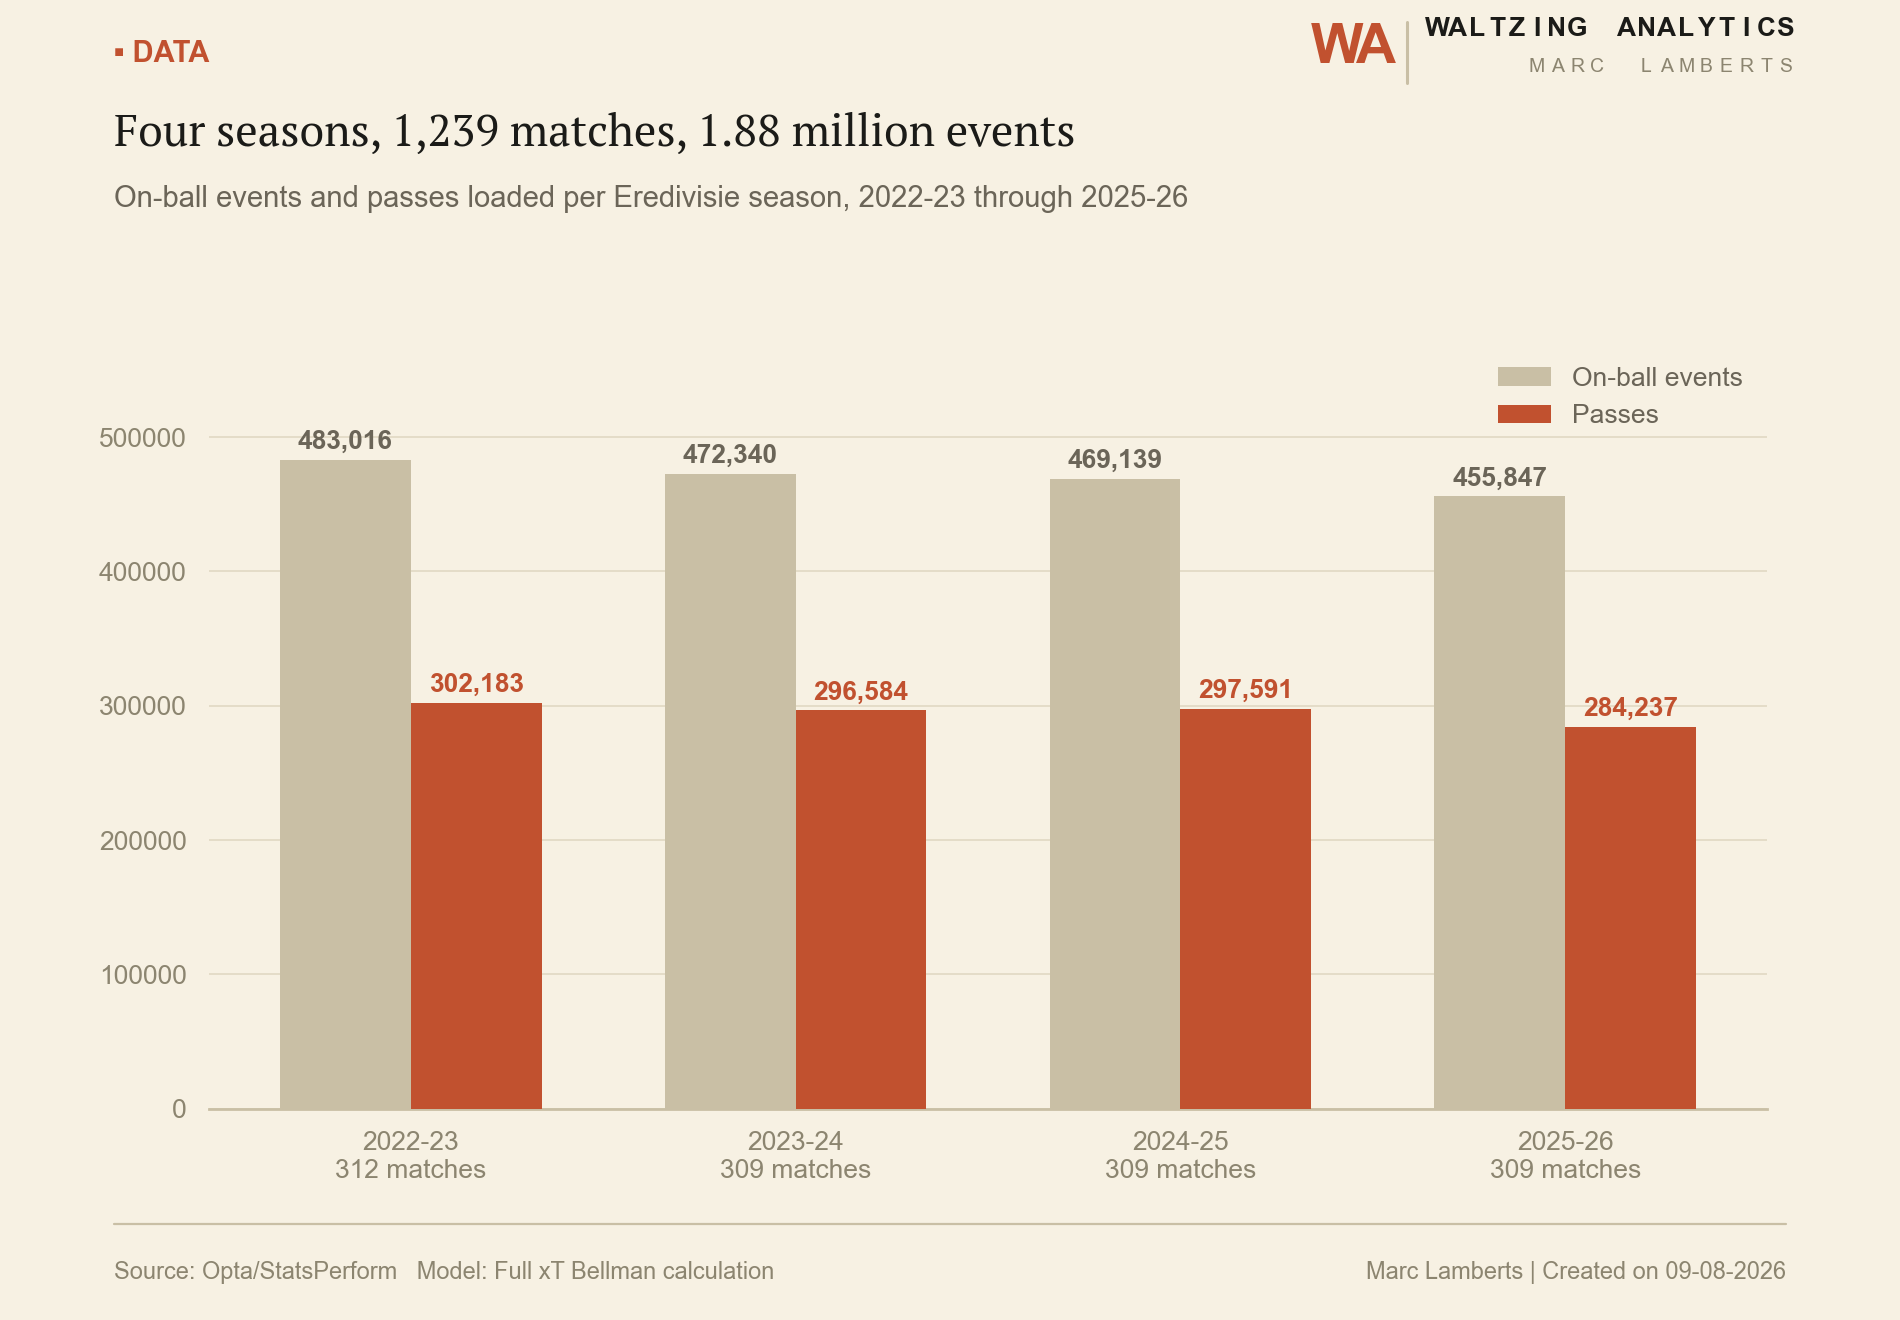
Bar chart of on-ball events and passes loaded per Eredivisie season, 2022-23 through 2025-26, totalling 1.88 million events across 1,239 matches
Four seasons, 1,239 matches, 1.88 million events — on-ball events and passes loaded per season.

Danger model: shot-quality sub-model validation

Every shot passes through five sub-models before it's scored — this is their validation performance, not just the headline number.
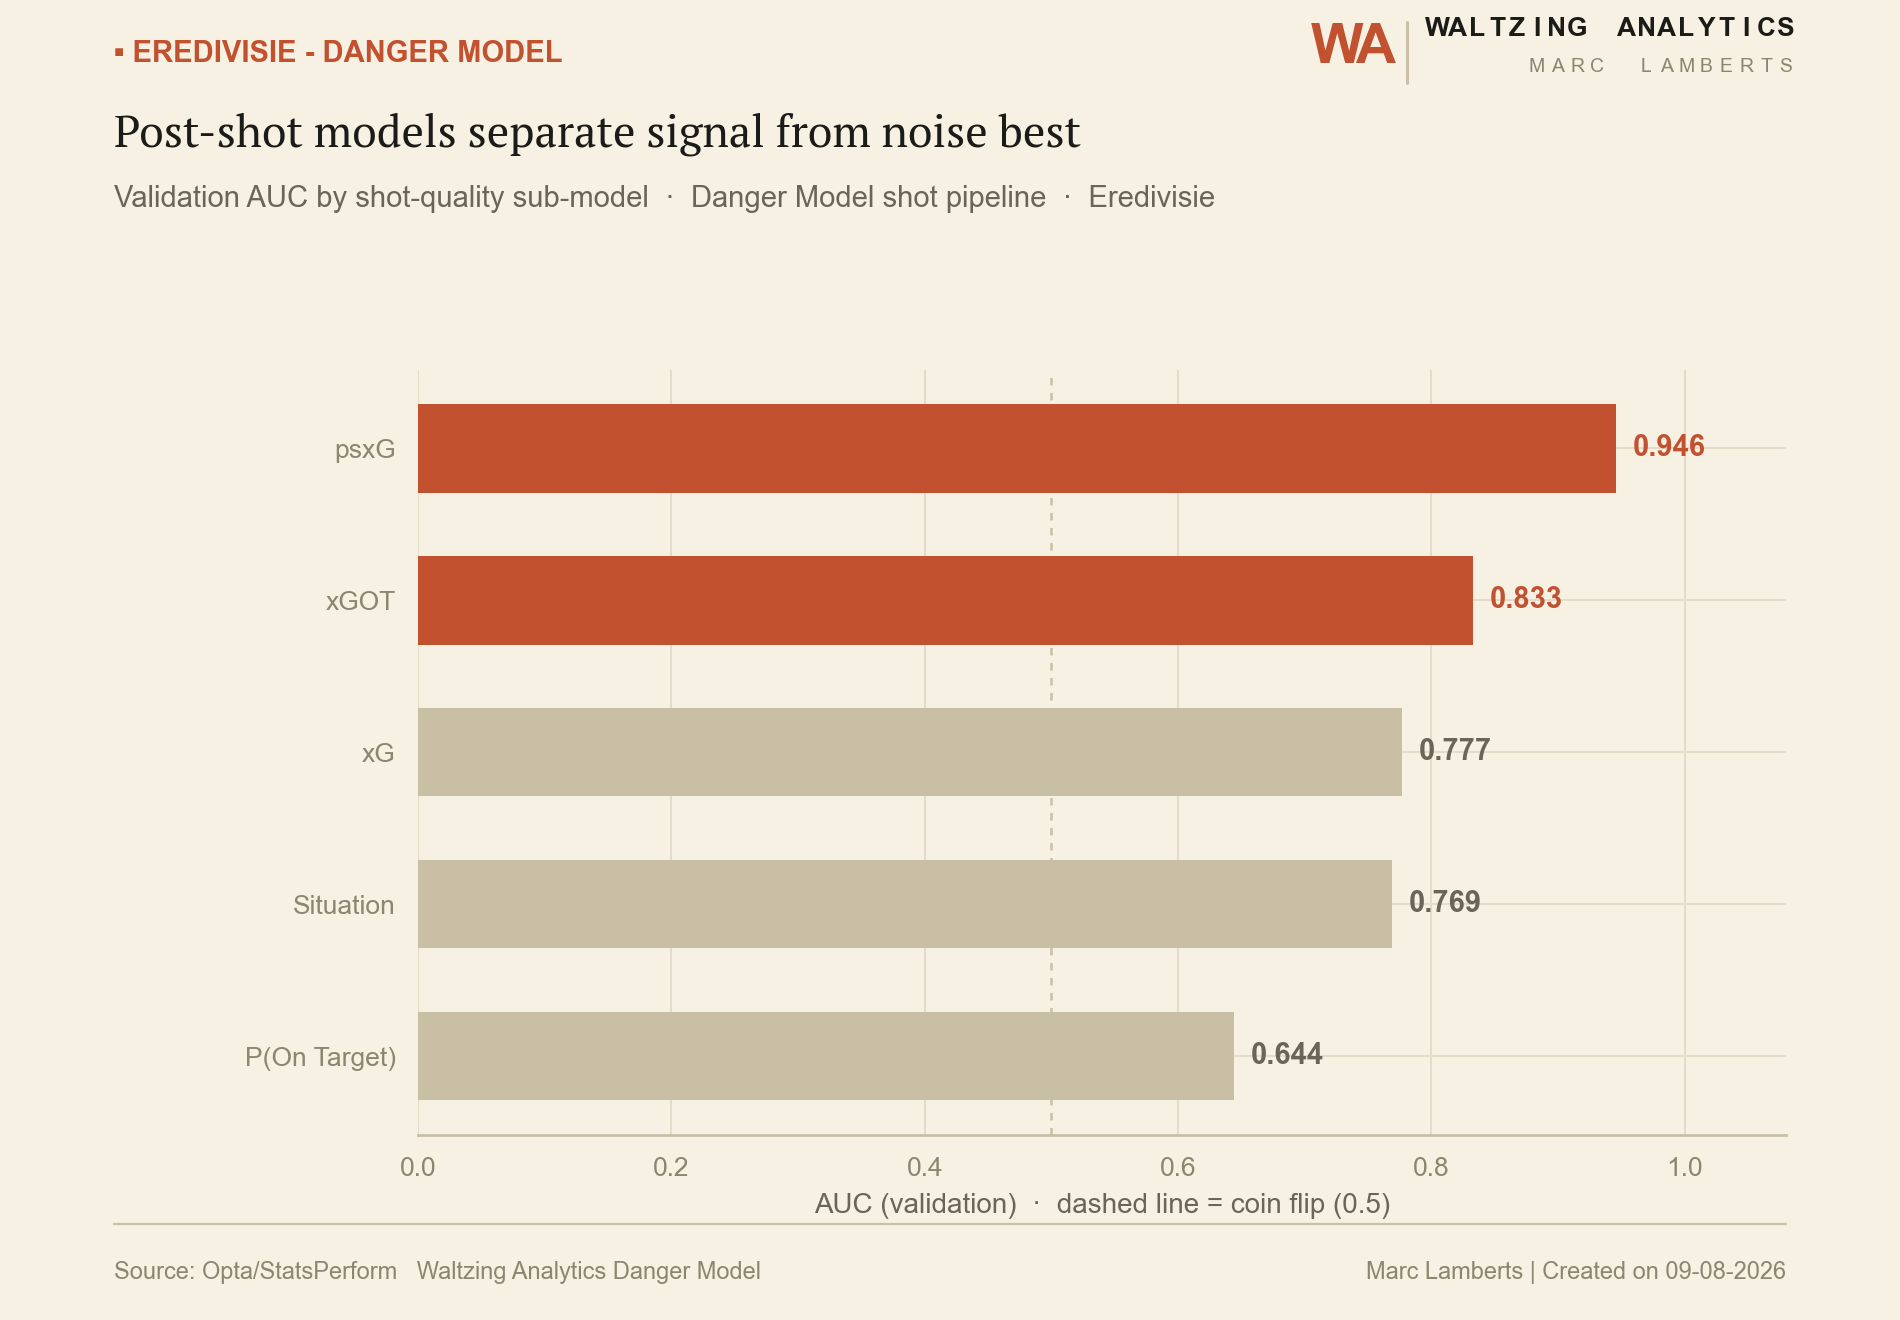
Horizontal bar chart of validation AUC for five Danger model shot-quality sub-models: psxG, xGOT, xG, Situation, and probability on target
Post-shot models separate signal from noise best — validation AUC across the five sub-models feeding the Danger model's shot pipeline.

xG model: calibration and what context adds

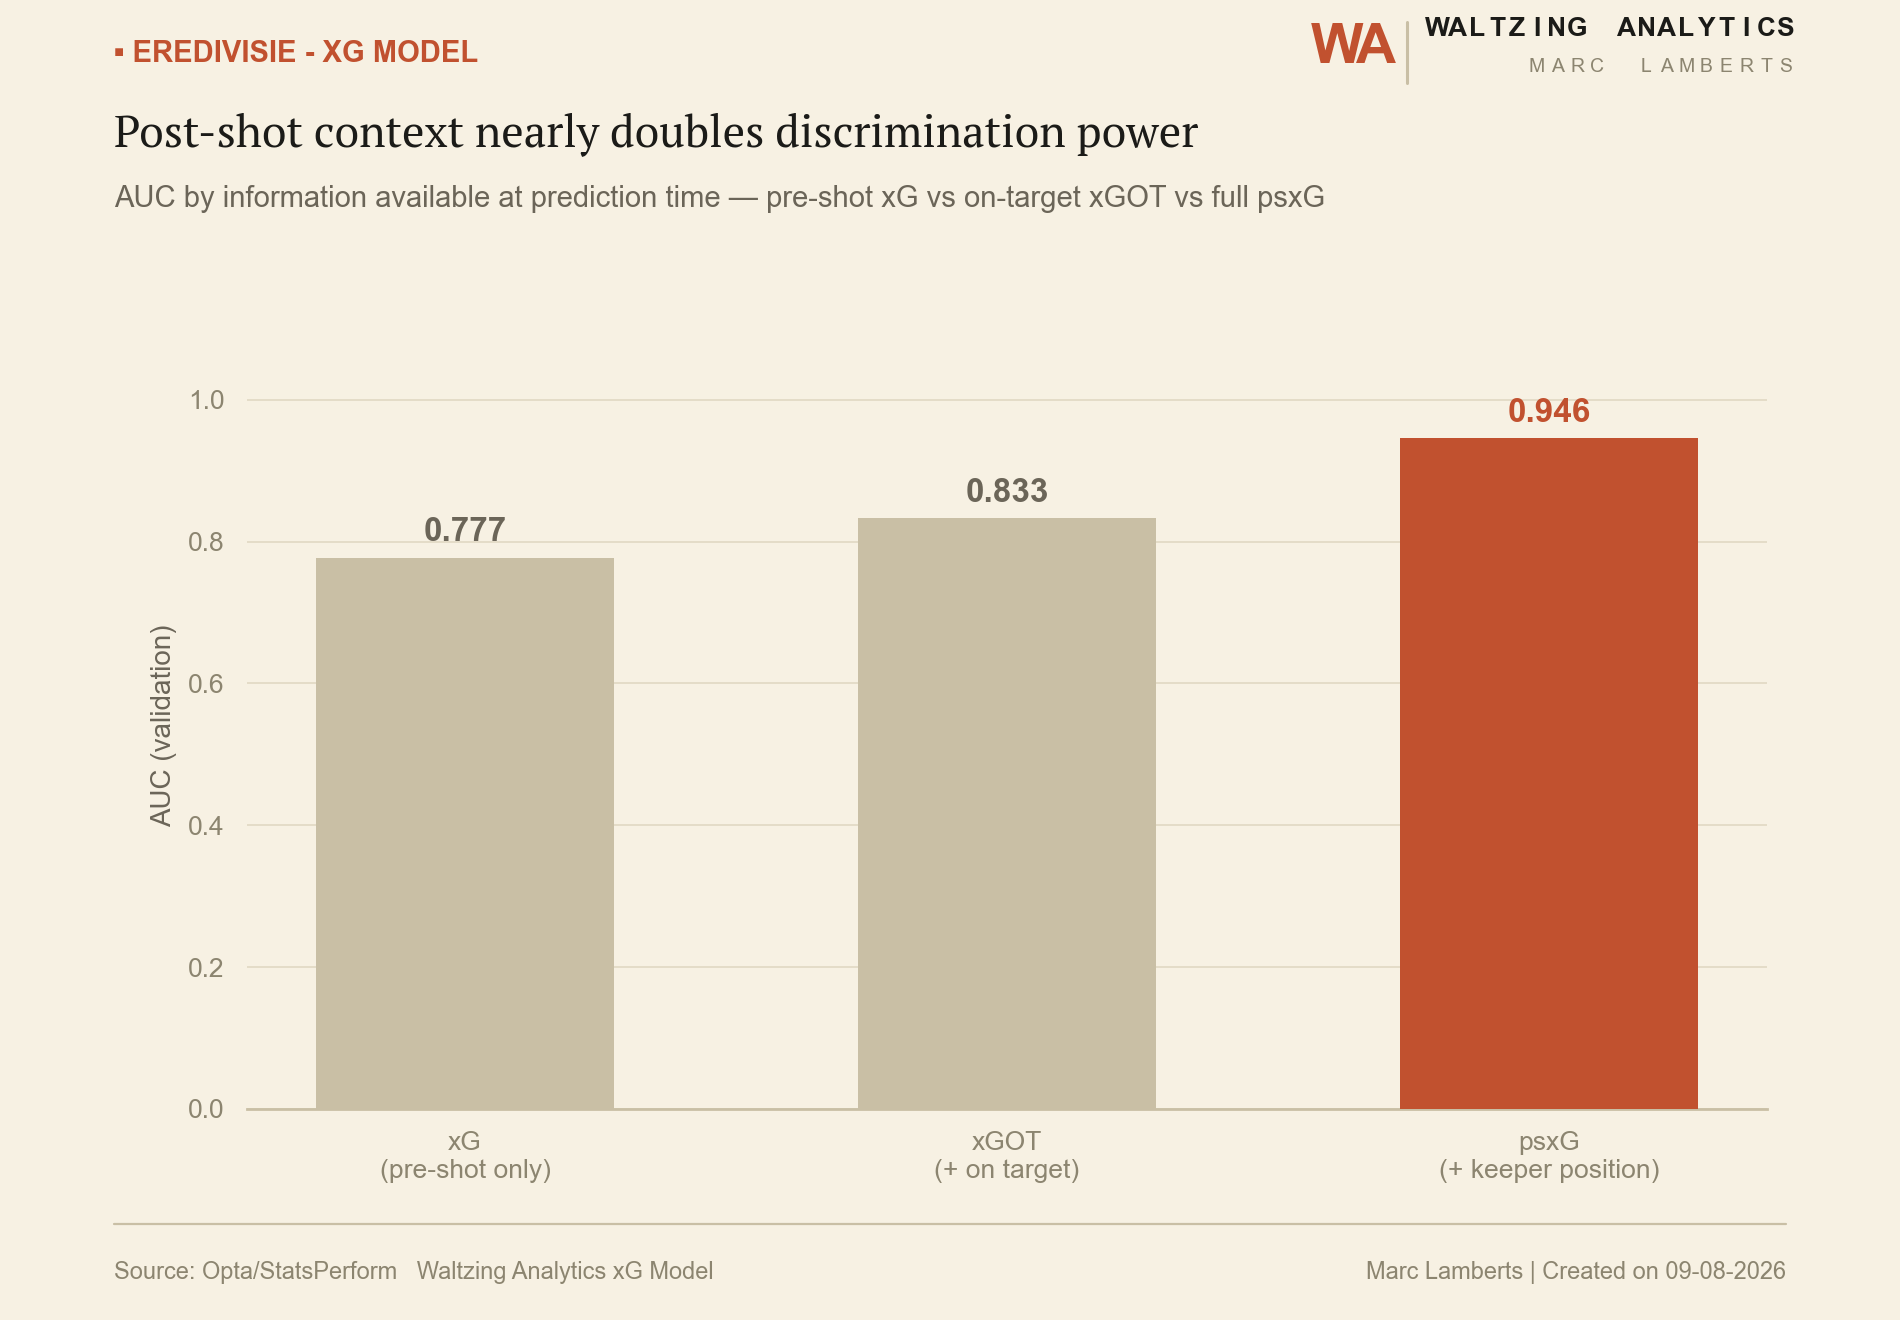
The Danger model's own xG sub-model, looked at two more ways: whether its predicted probabilities can be trusted at face value, and how much more it learns once post-shot context (was it on target? where was the keeper?) is added.
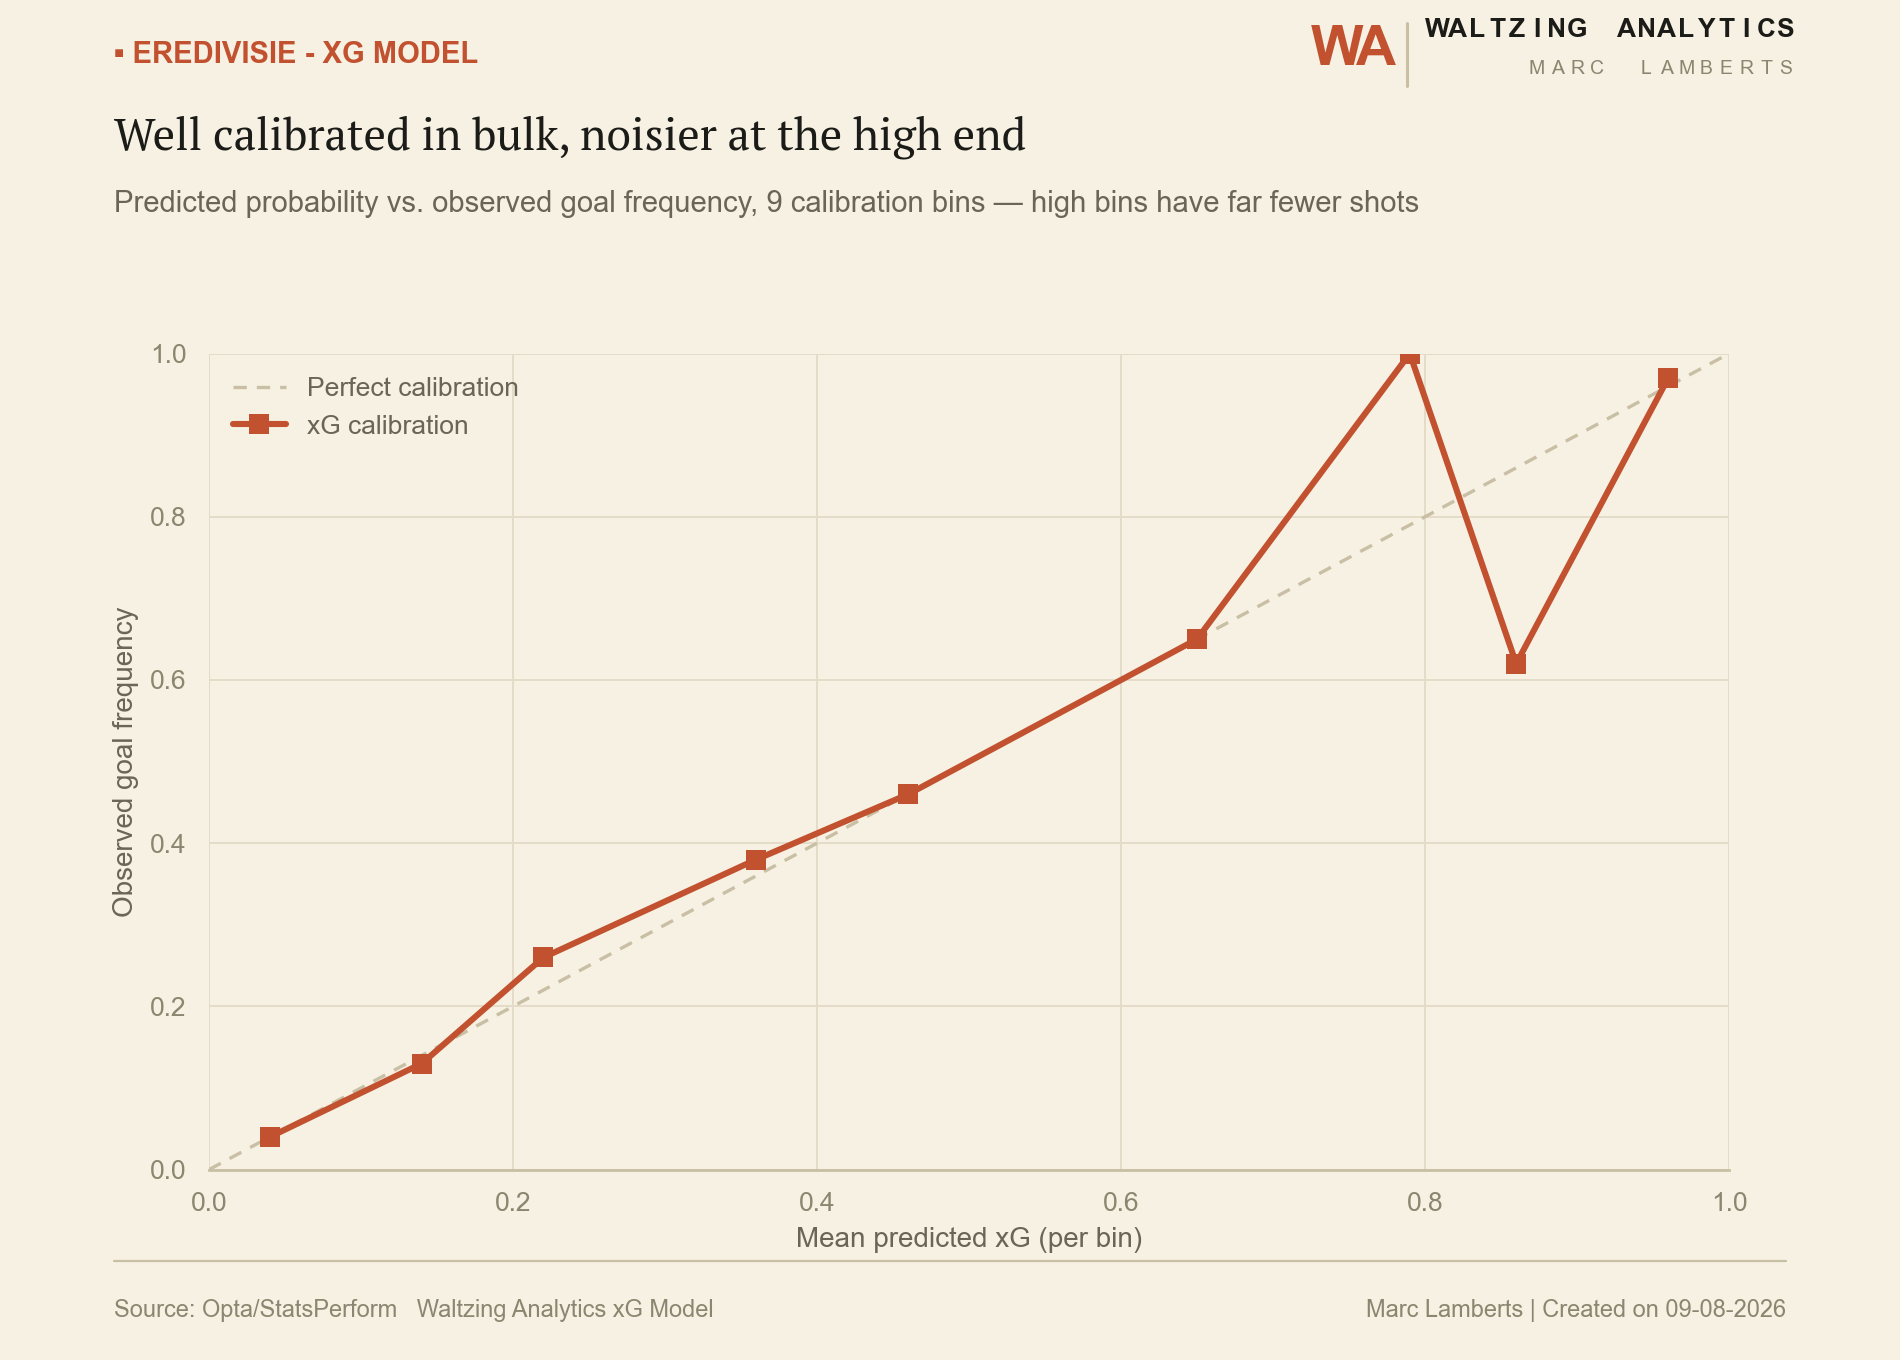
Calibration curve comparing predicted xG probability to observed goal frequency across 9 bins
Well calibrated in bulk, noisier at the high end — predicted probability vs. observed goal frequency, 9 calibration bins.
Bar chart comparing AUC for xG, xGOT, and psxG models, showing discrimination power increasing with more post-shot context
Post-shot context nearly doubles discrimination power — AUC by information available at prediction time.

Cross model: four outcomes, one pipeline

Every open-play cross is scored for completion, chance creation, goal contribution and whether it's defended — four separate classifiers sharing one feature pipeline.
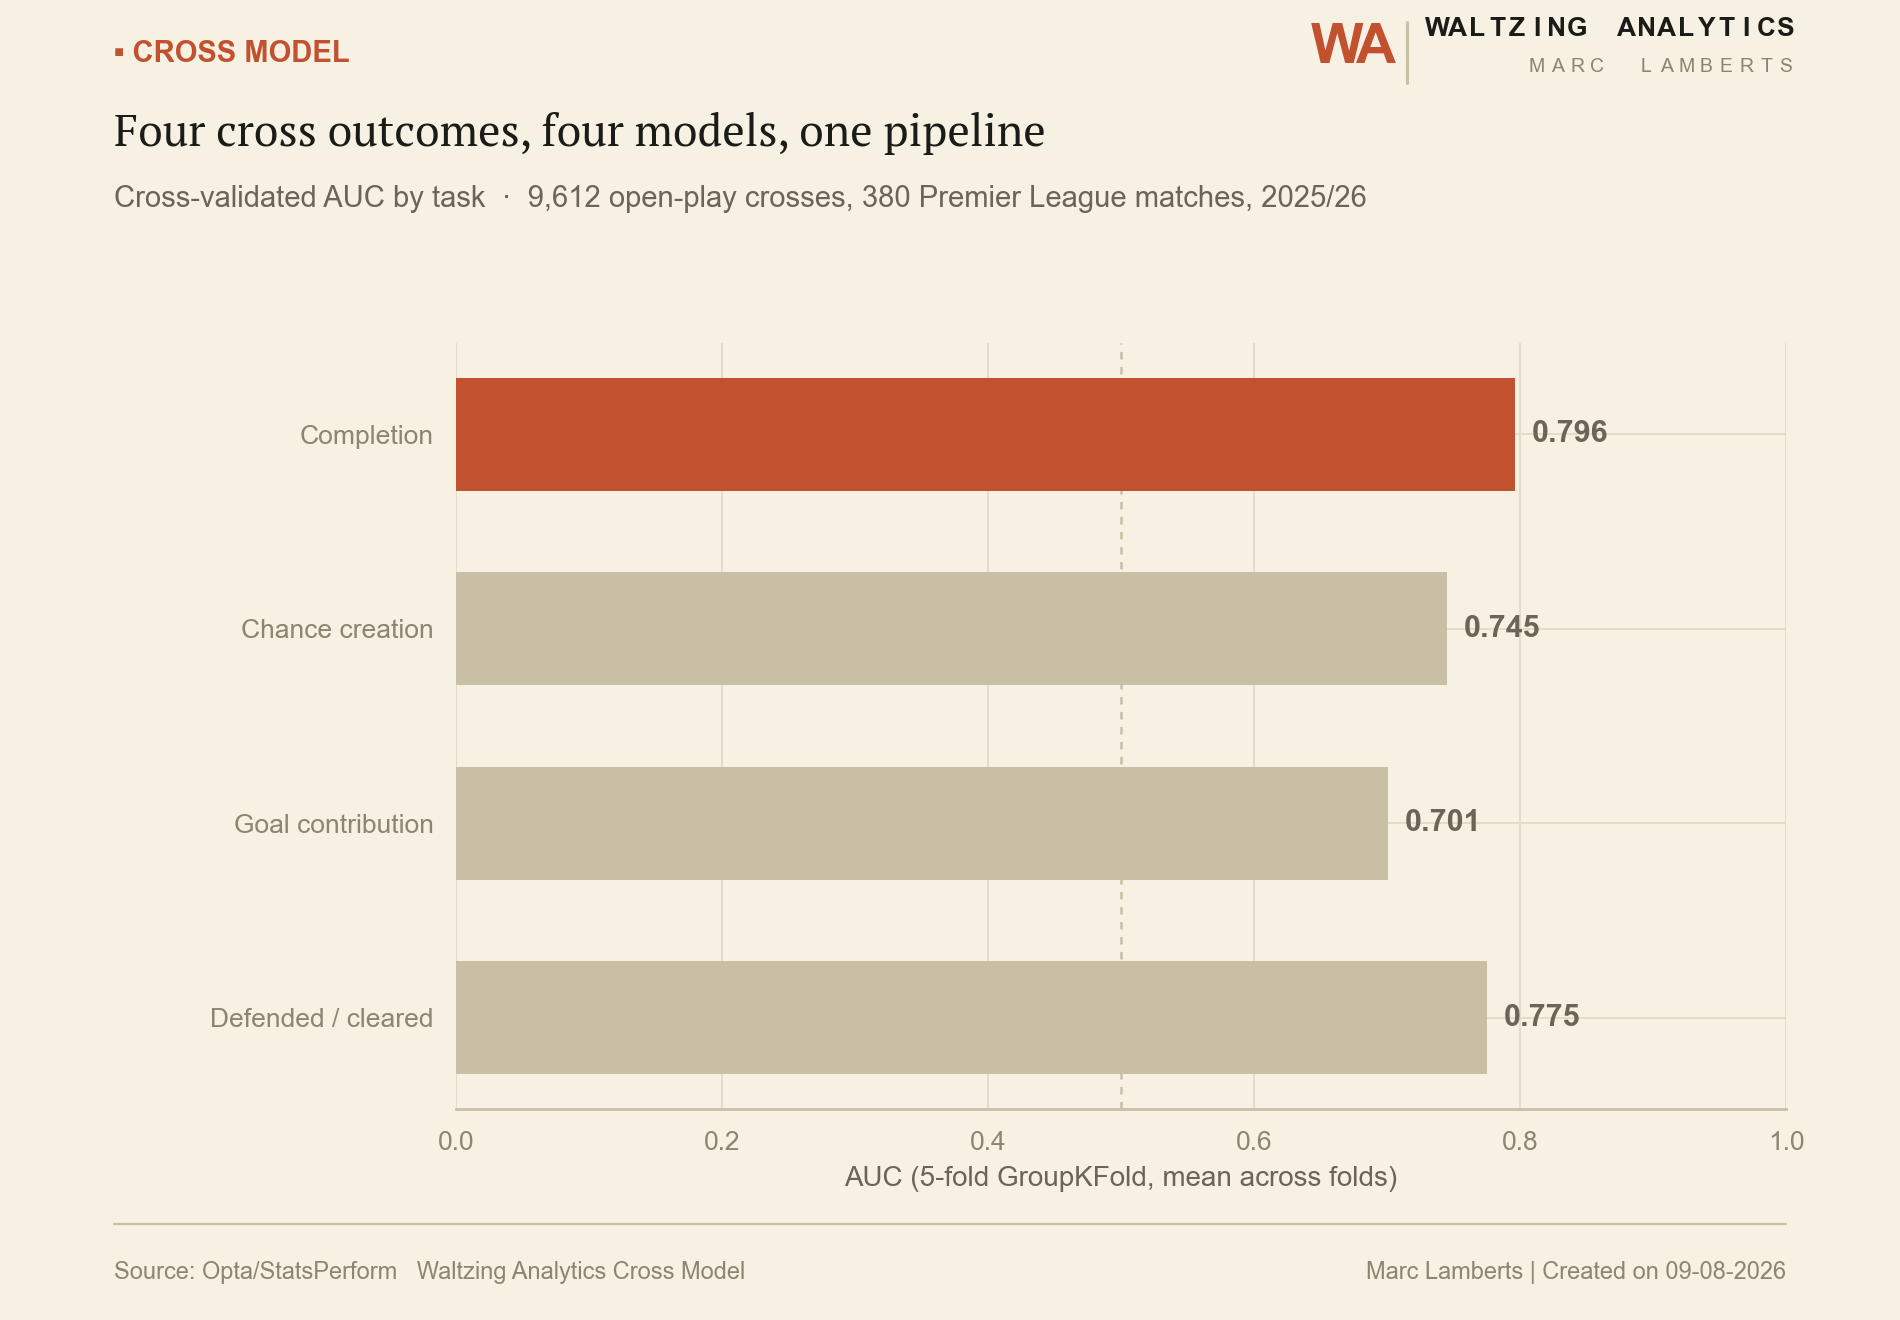
Horizontal bar chart of cross-validated AUC for four cross-model tasks: completion, chance creation, goal contribution, and defended or cleared
Four cross outcomes, four models, one pipeline — cross-validated AUC by task, 9,612 open-play crosses across 380 Premier League matches.
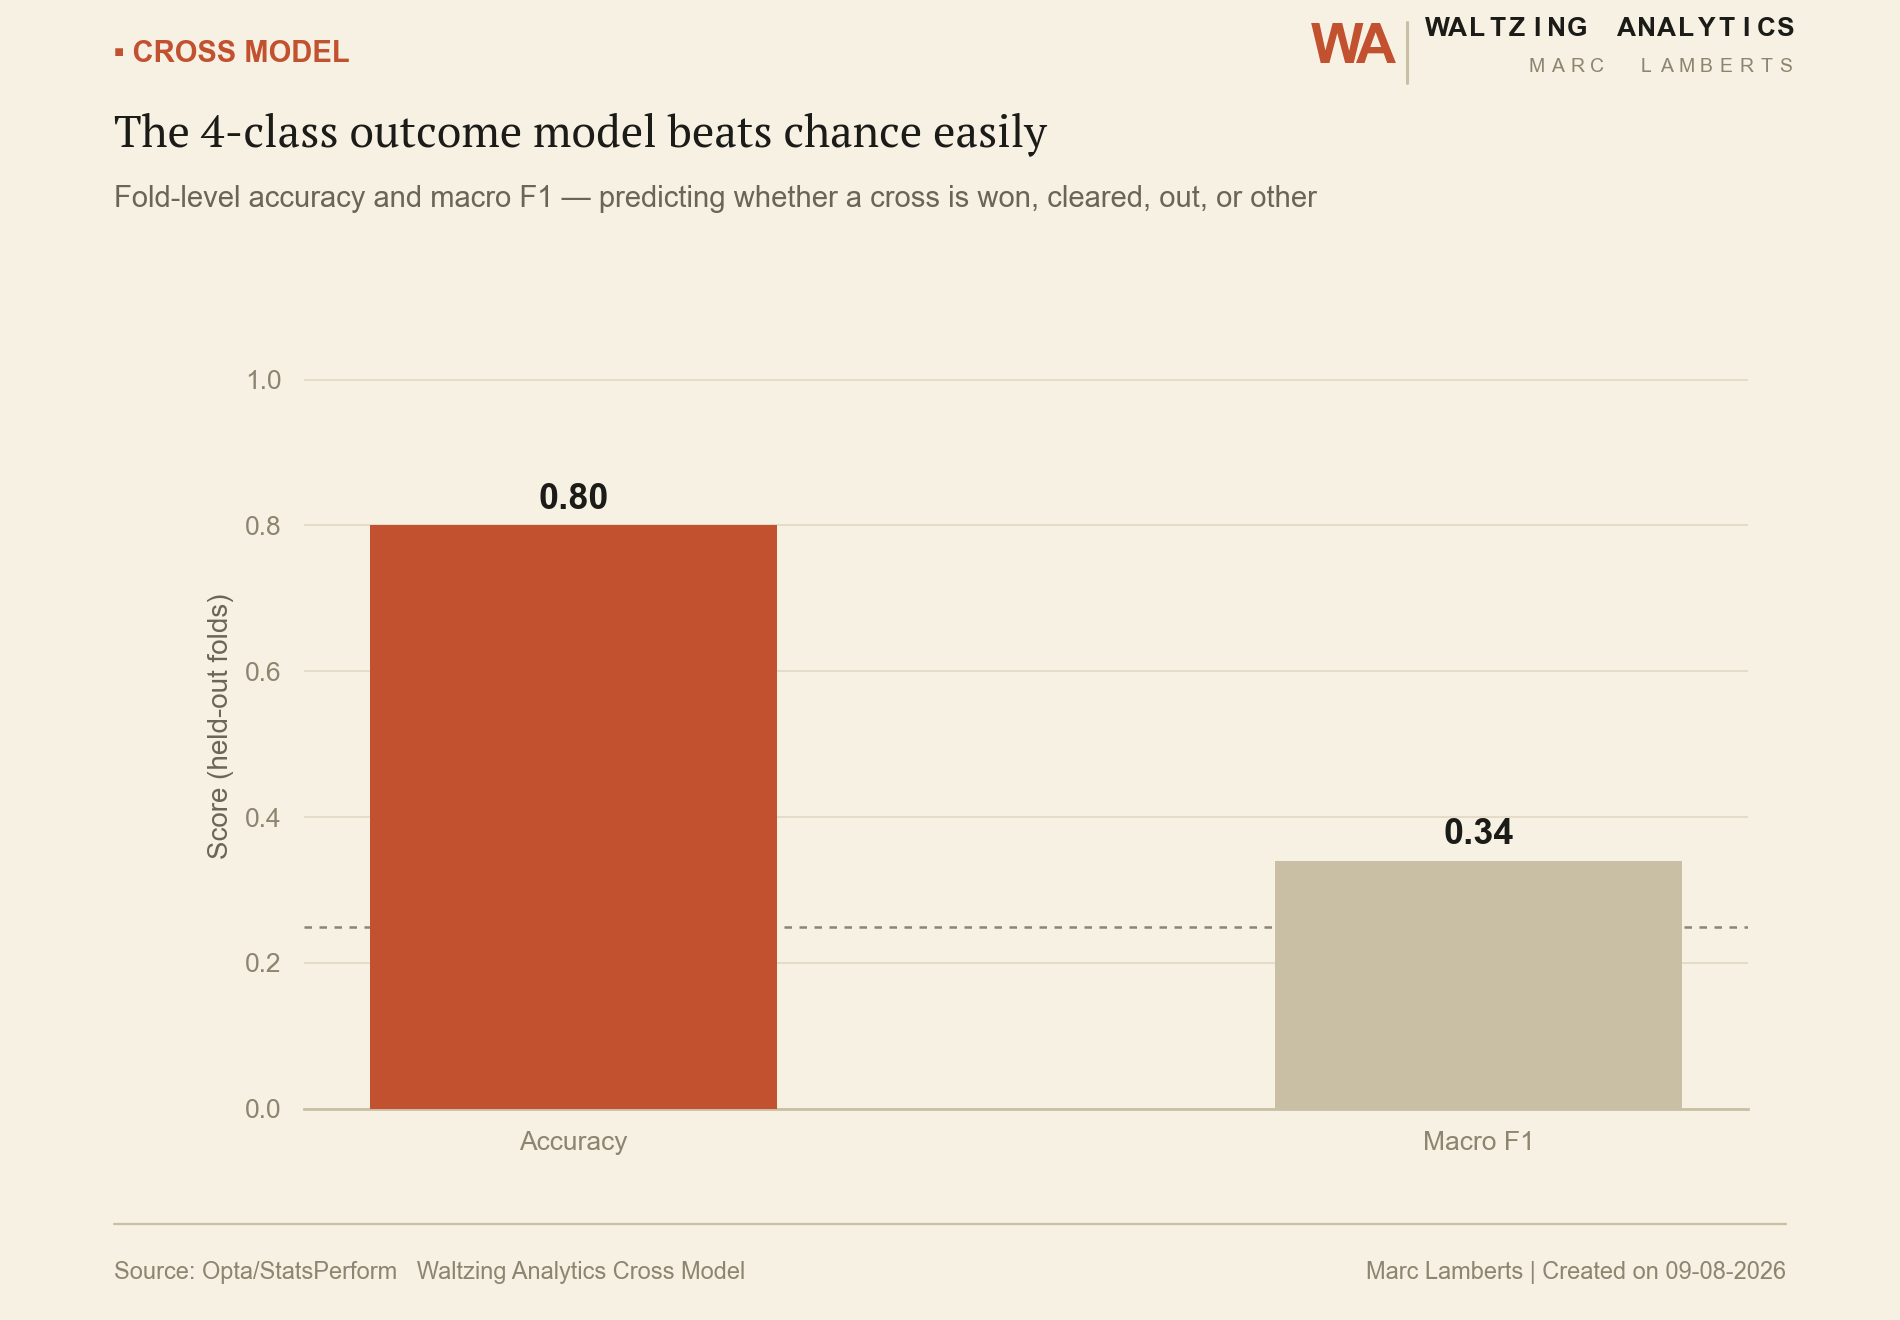
Bar chart of accuracy and macro F1 for a 4-class cross outcome model
The 4-class outcome model beats chance easily — fold-level accuracy and macro F1 for predicting whether a cross is won, cleared, out, or other.

Clearance model: where does the header land?

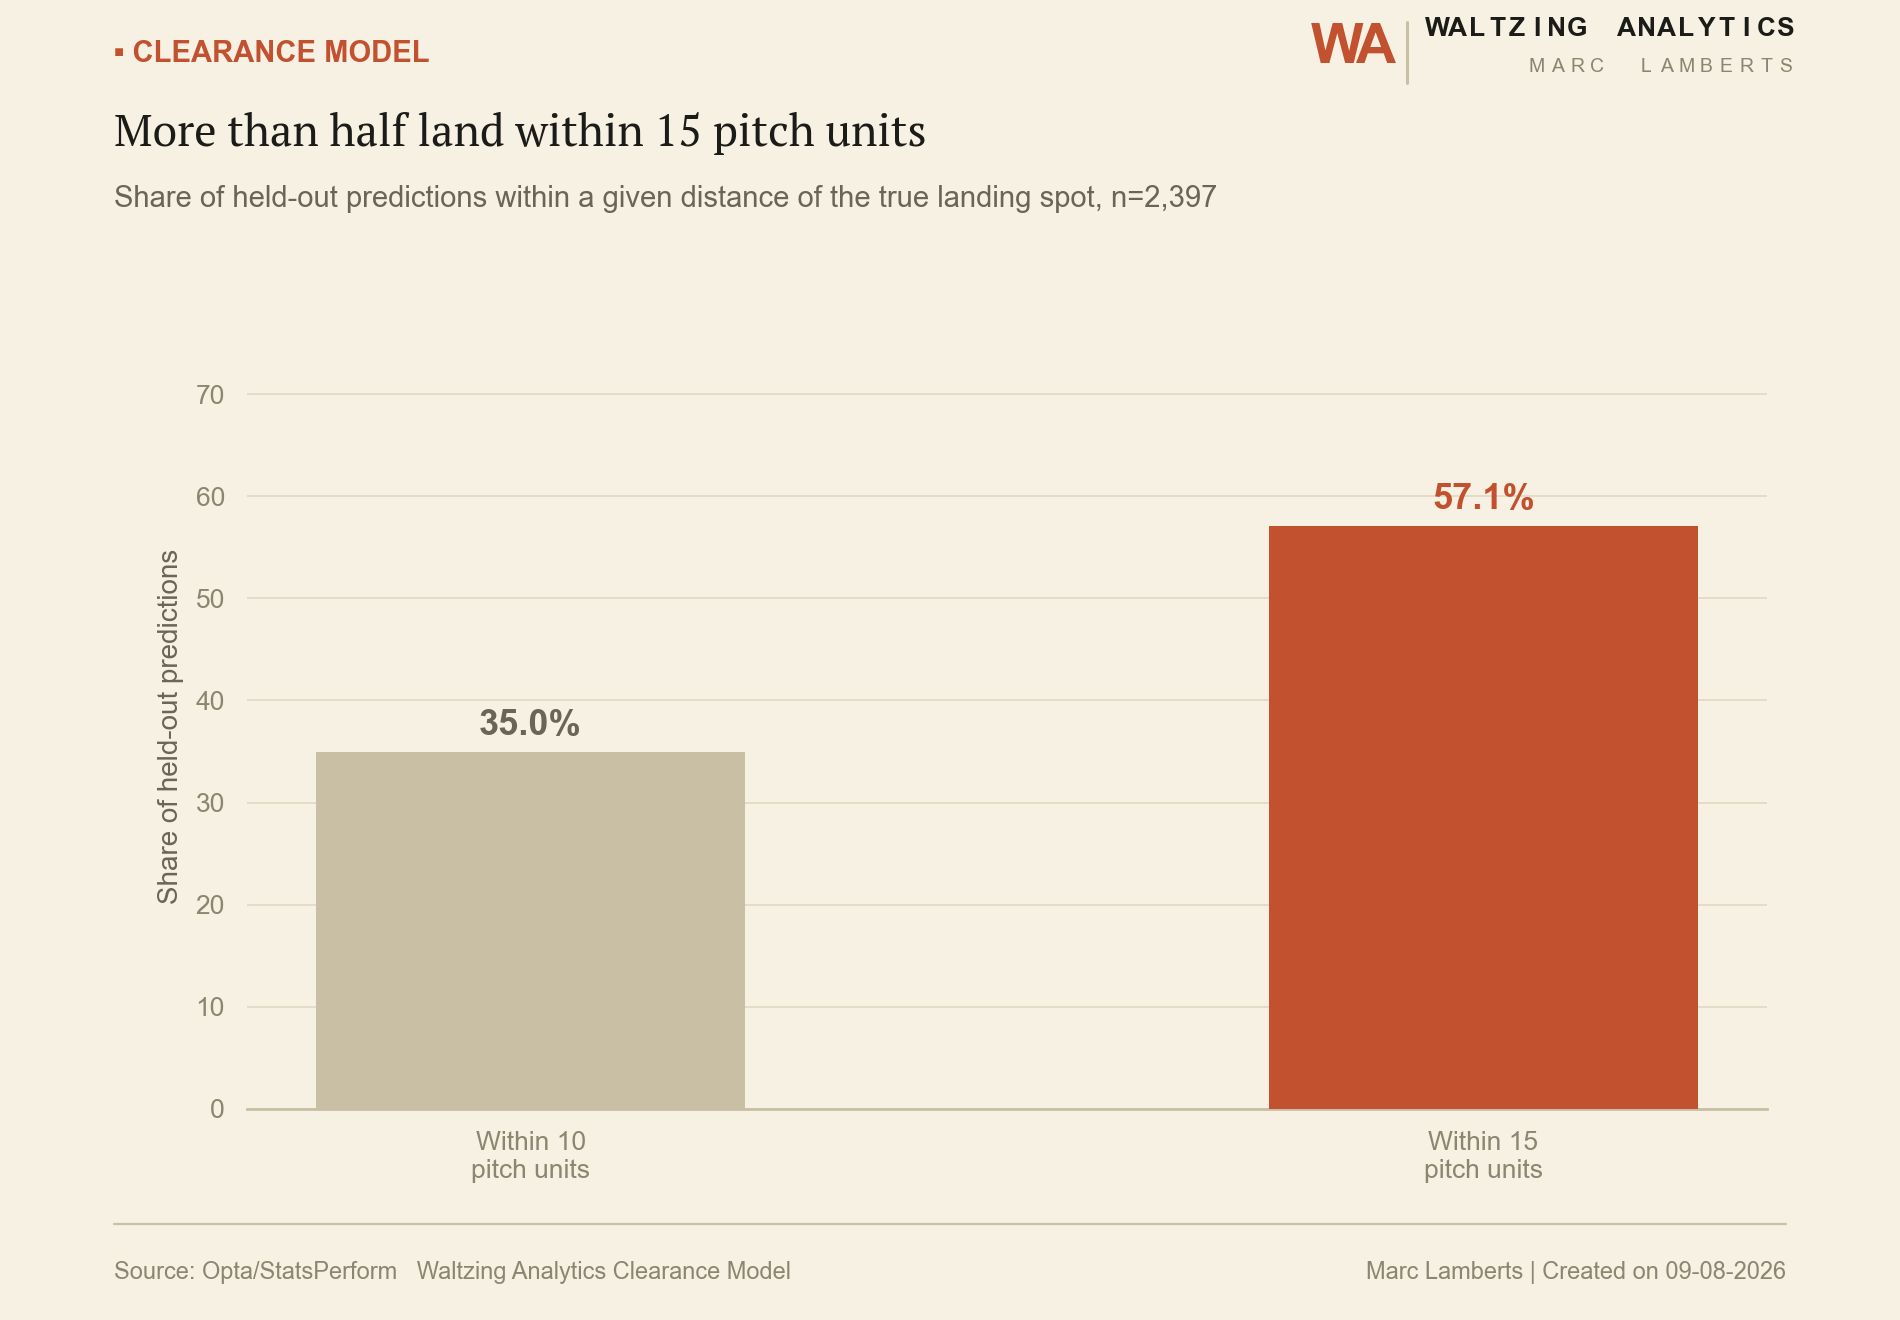
A headed-clearance landing-location model, checked against a naive baseline and against a distance threshold that actually matters for what happens next.
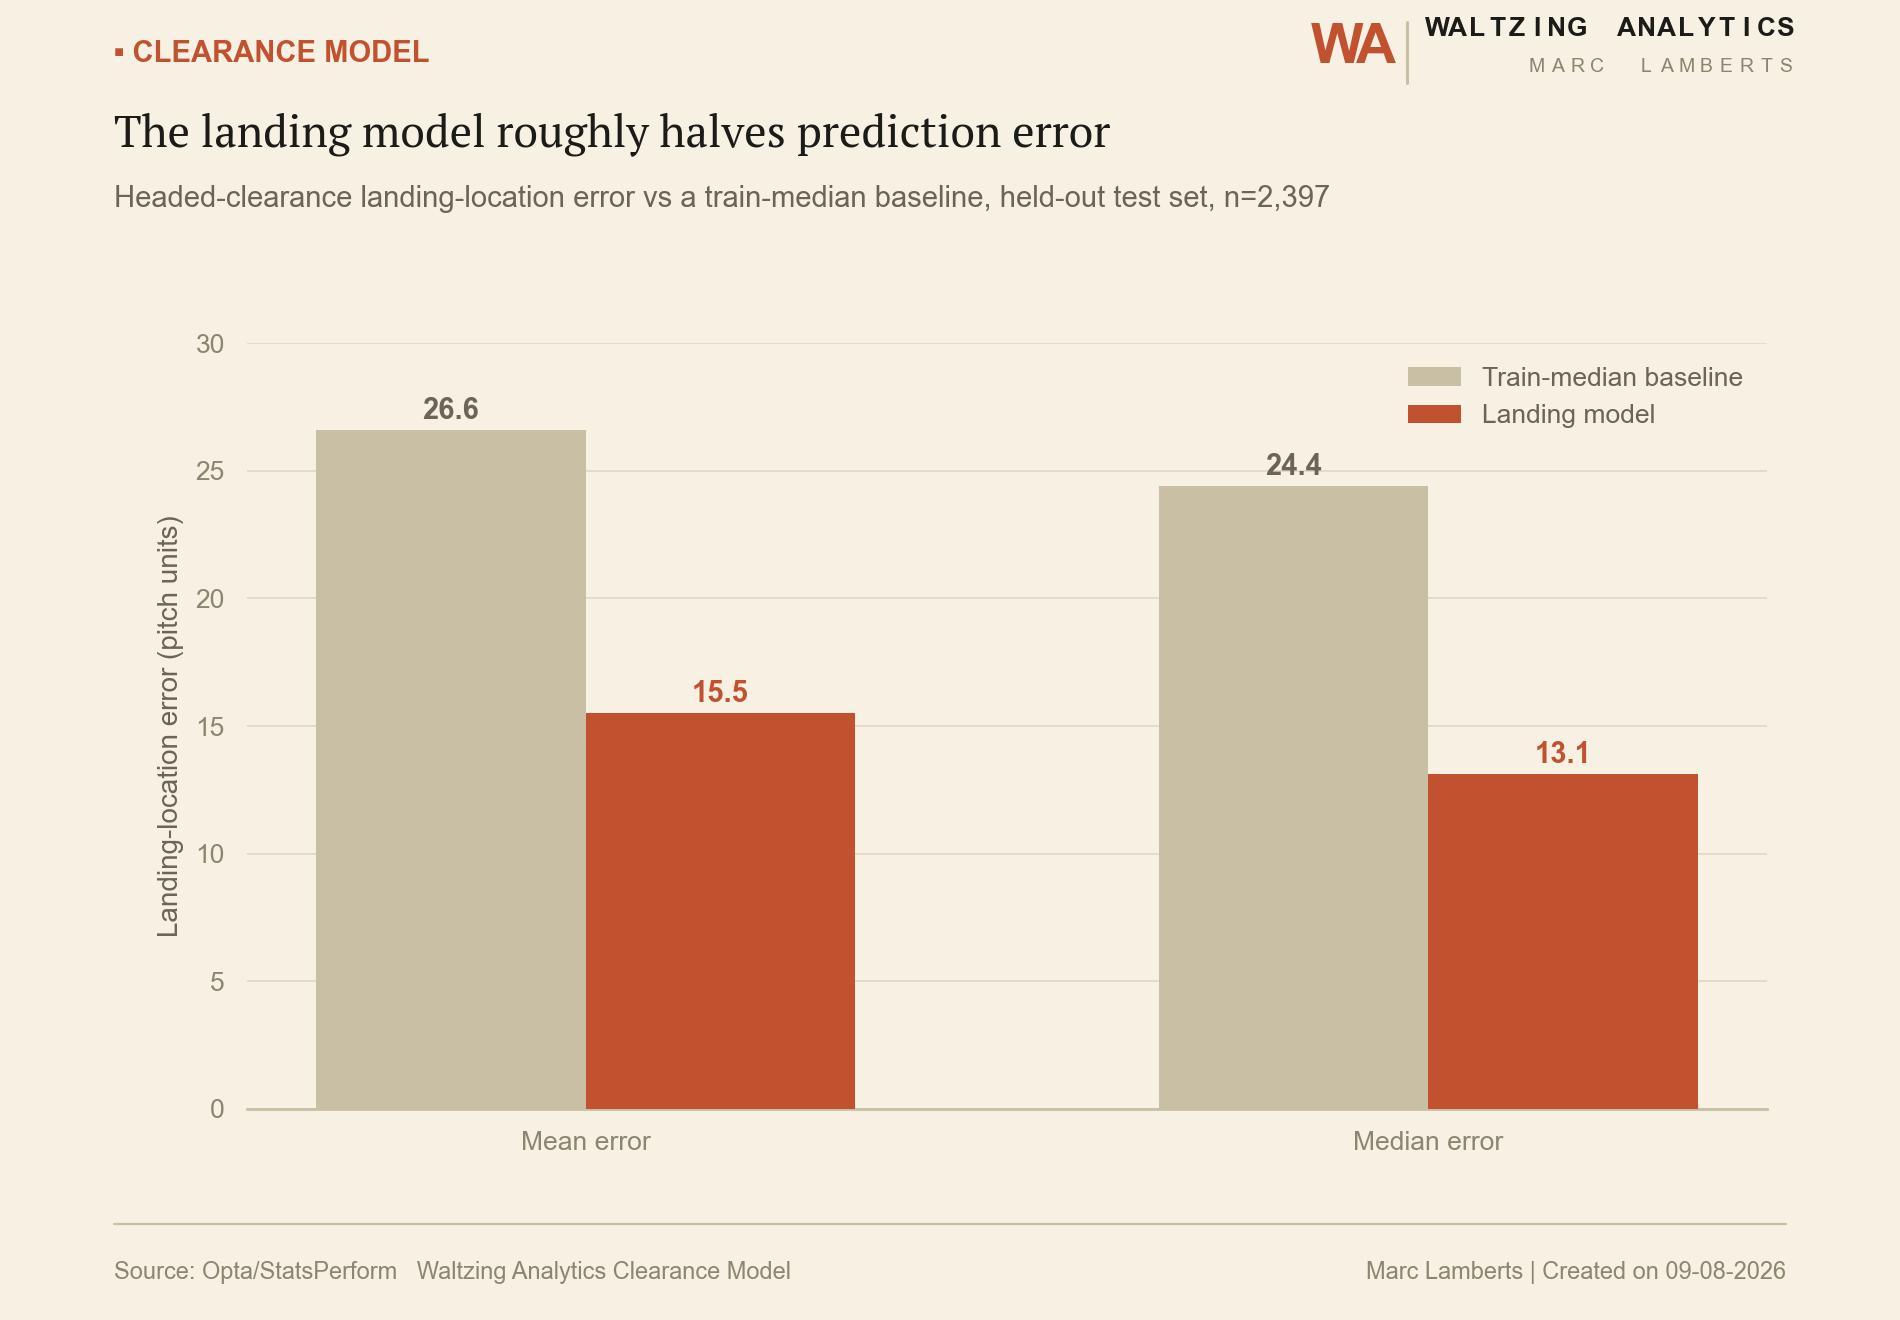
Grouped bar chart comparing headed-clearance landing-location error for the model versus a train-median baseline
The landing model roughly halves prediction error — landing-location error vs. a train-median baseline, held-out test set, n=2,397.
Bar chart showing the share of headed-clearance landing predictions within 10 and 15 pitch units of the true location
More than half land within 15 pitch units — share of held-out predictions within a given distance of the true landing spot.

xT model: the full grid

Before building the contextual, Bellman-fitted version, the pipeline starts from the classic fixed xT grid — the baseline every improvement gets measured against.
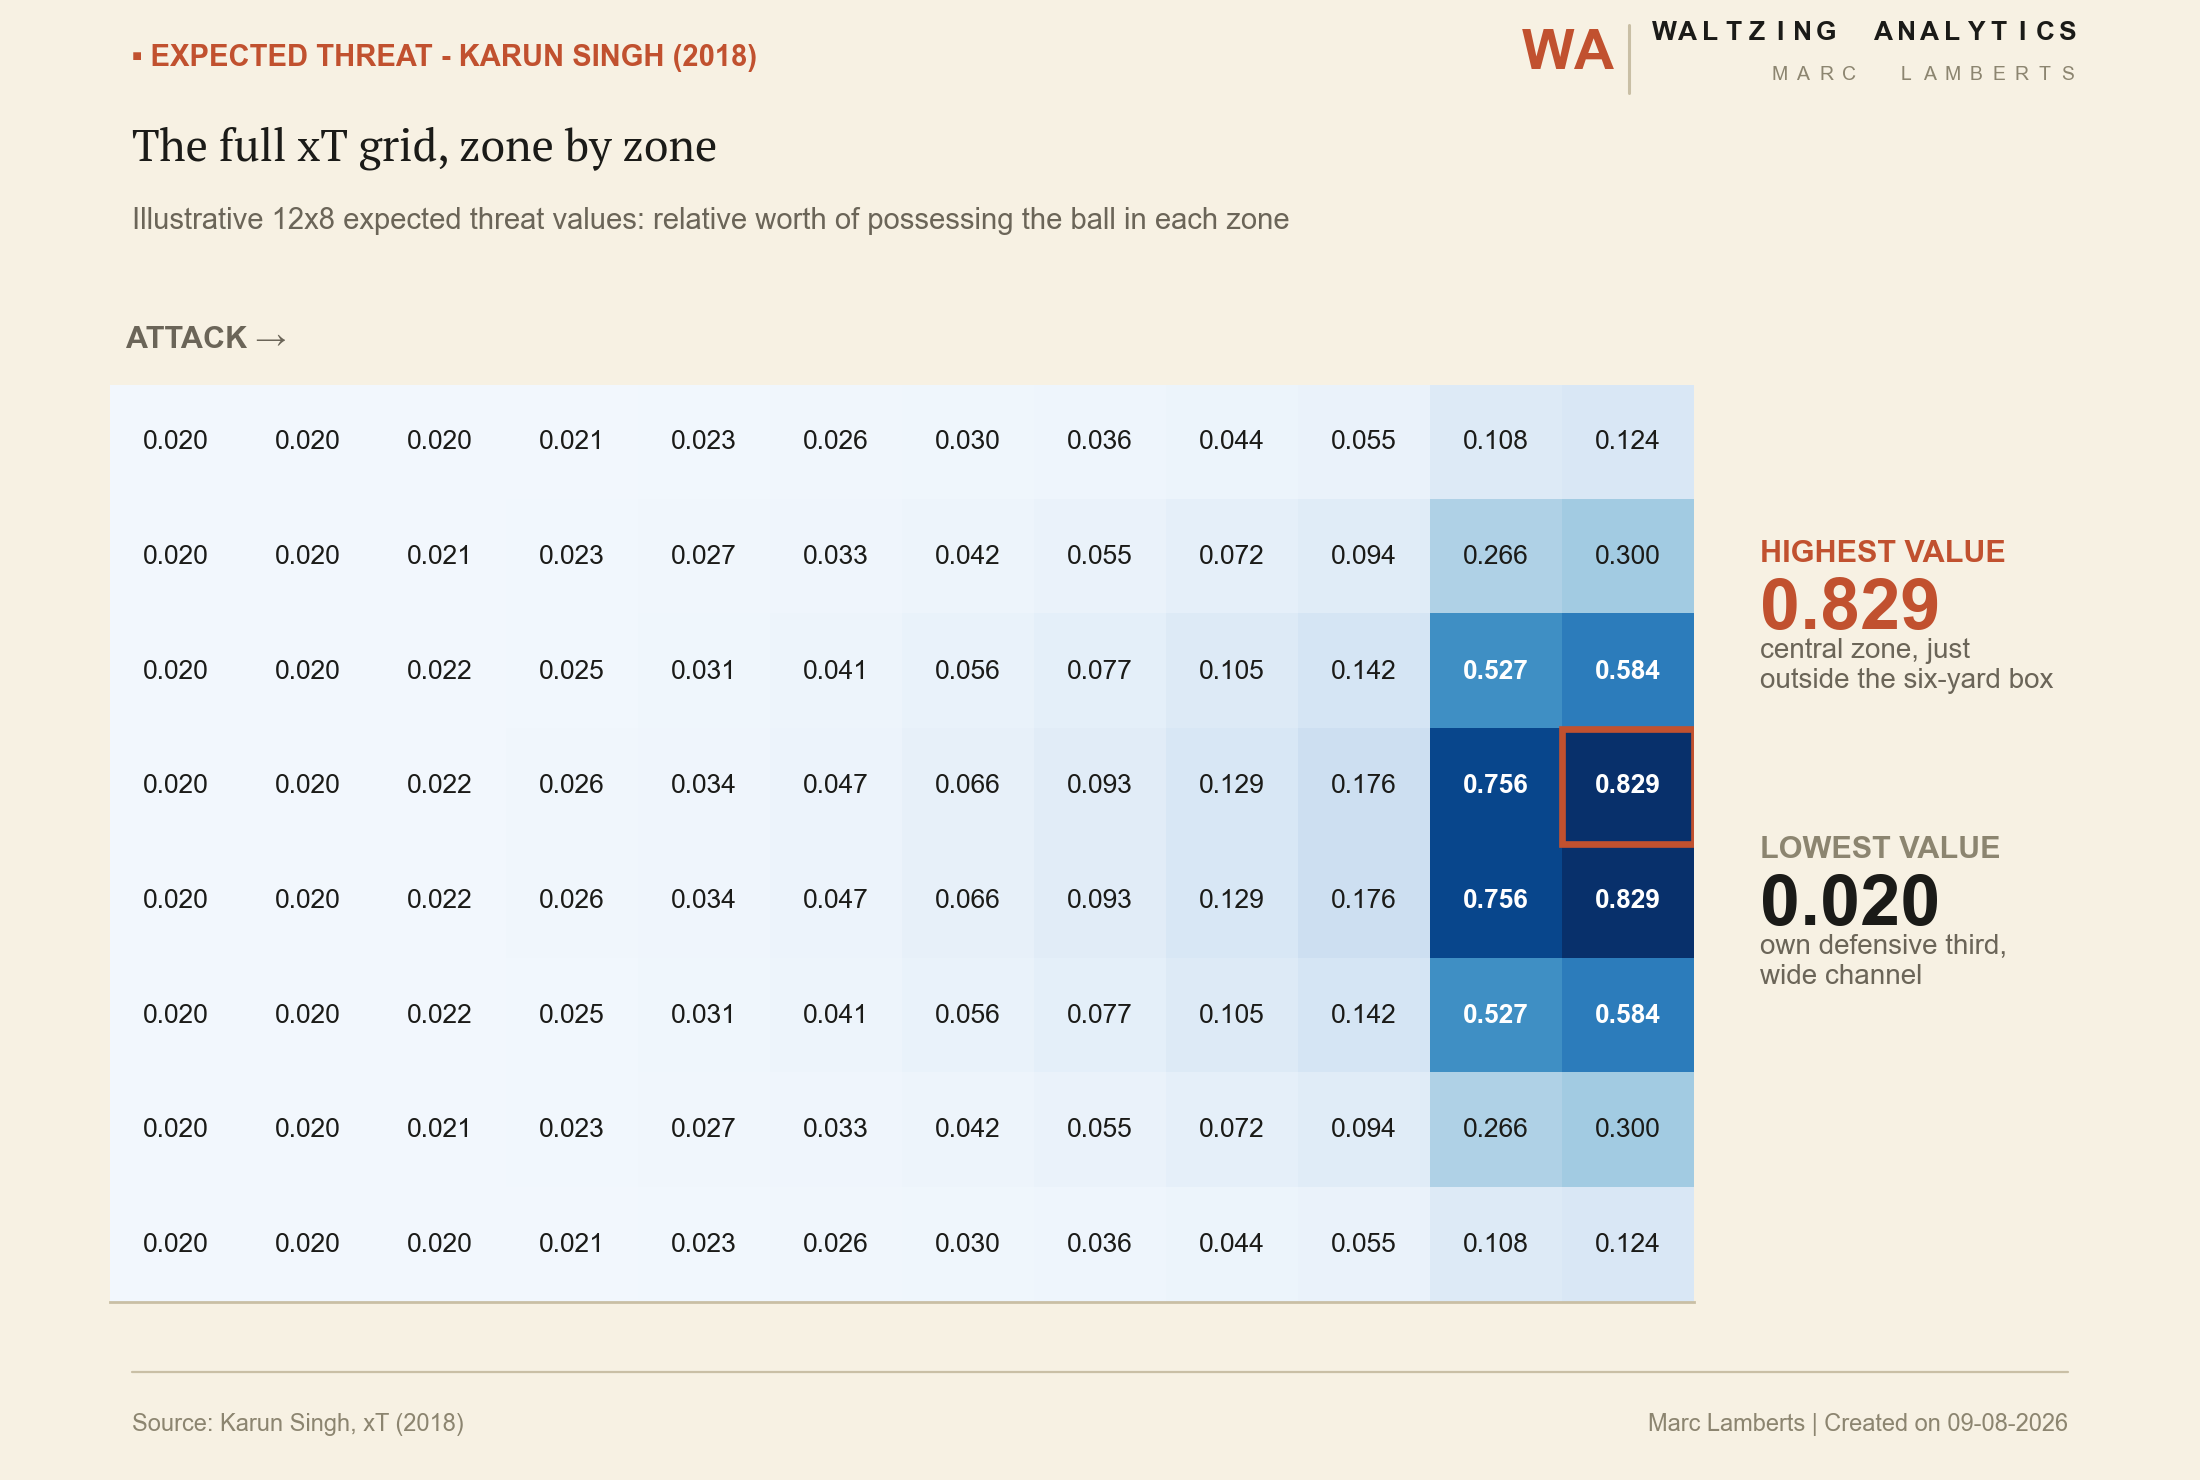
Heatmap of the full 12 by 8 expected threat grid, zone by zone, from Karun Singh's 2018 xT model
The full xT grid, zone by zone — illustrative 12×8 expected threat values, the relative worth of possessing the ball in each zone (Karun Singh, xT, 2018).

xT & shot-clock: modelled as a Markov Decision Process

Treating possession as a sequence of states and actions, not a lookup table — the same framework behind the xT model and the shot-clock work.
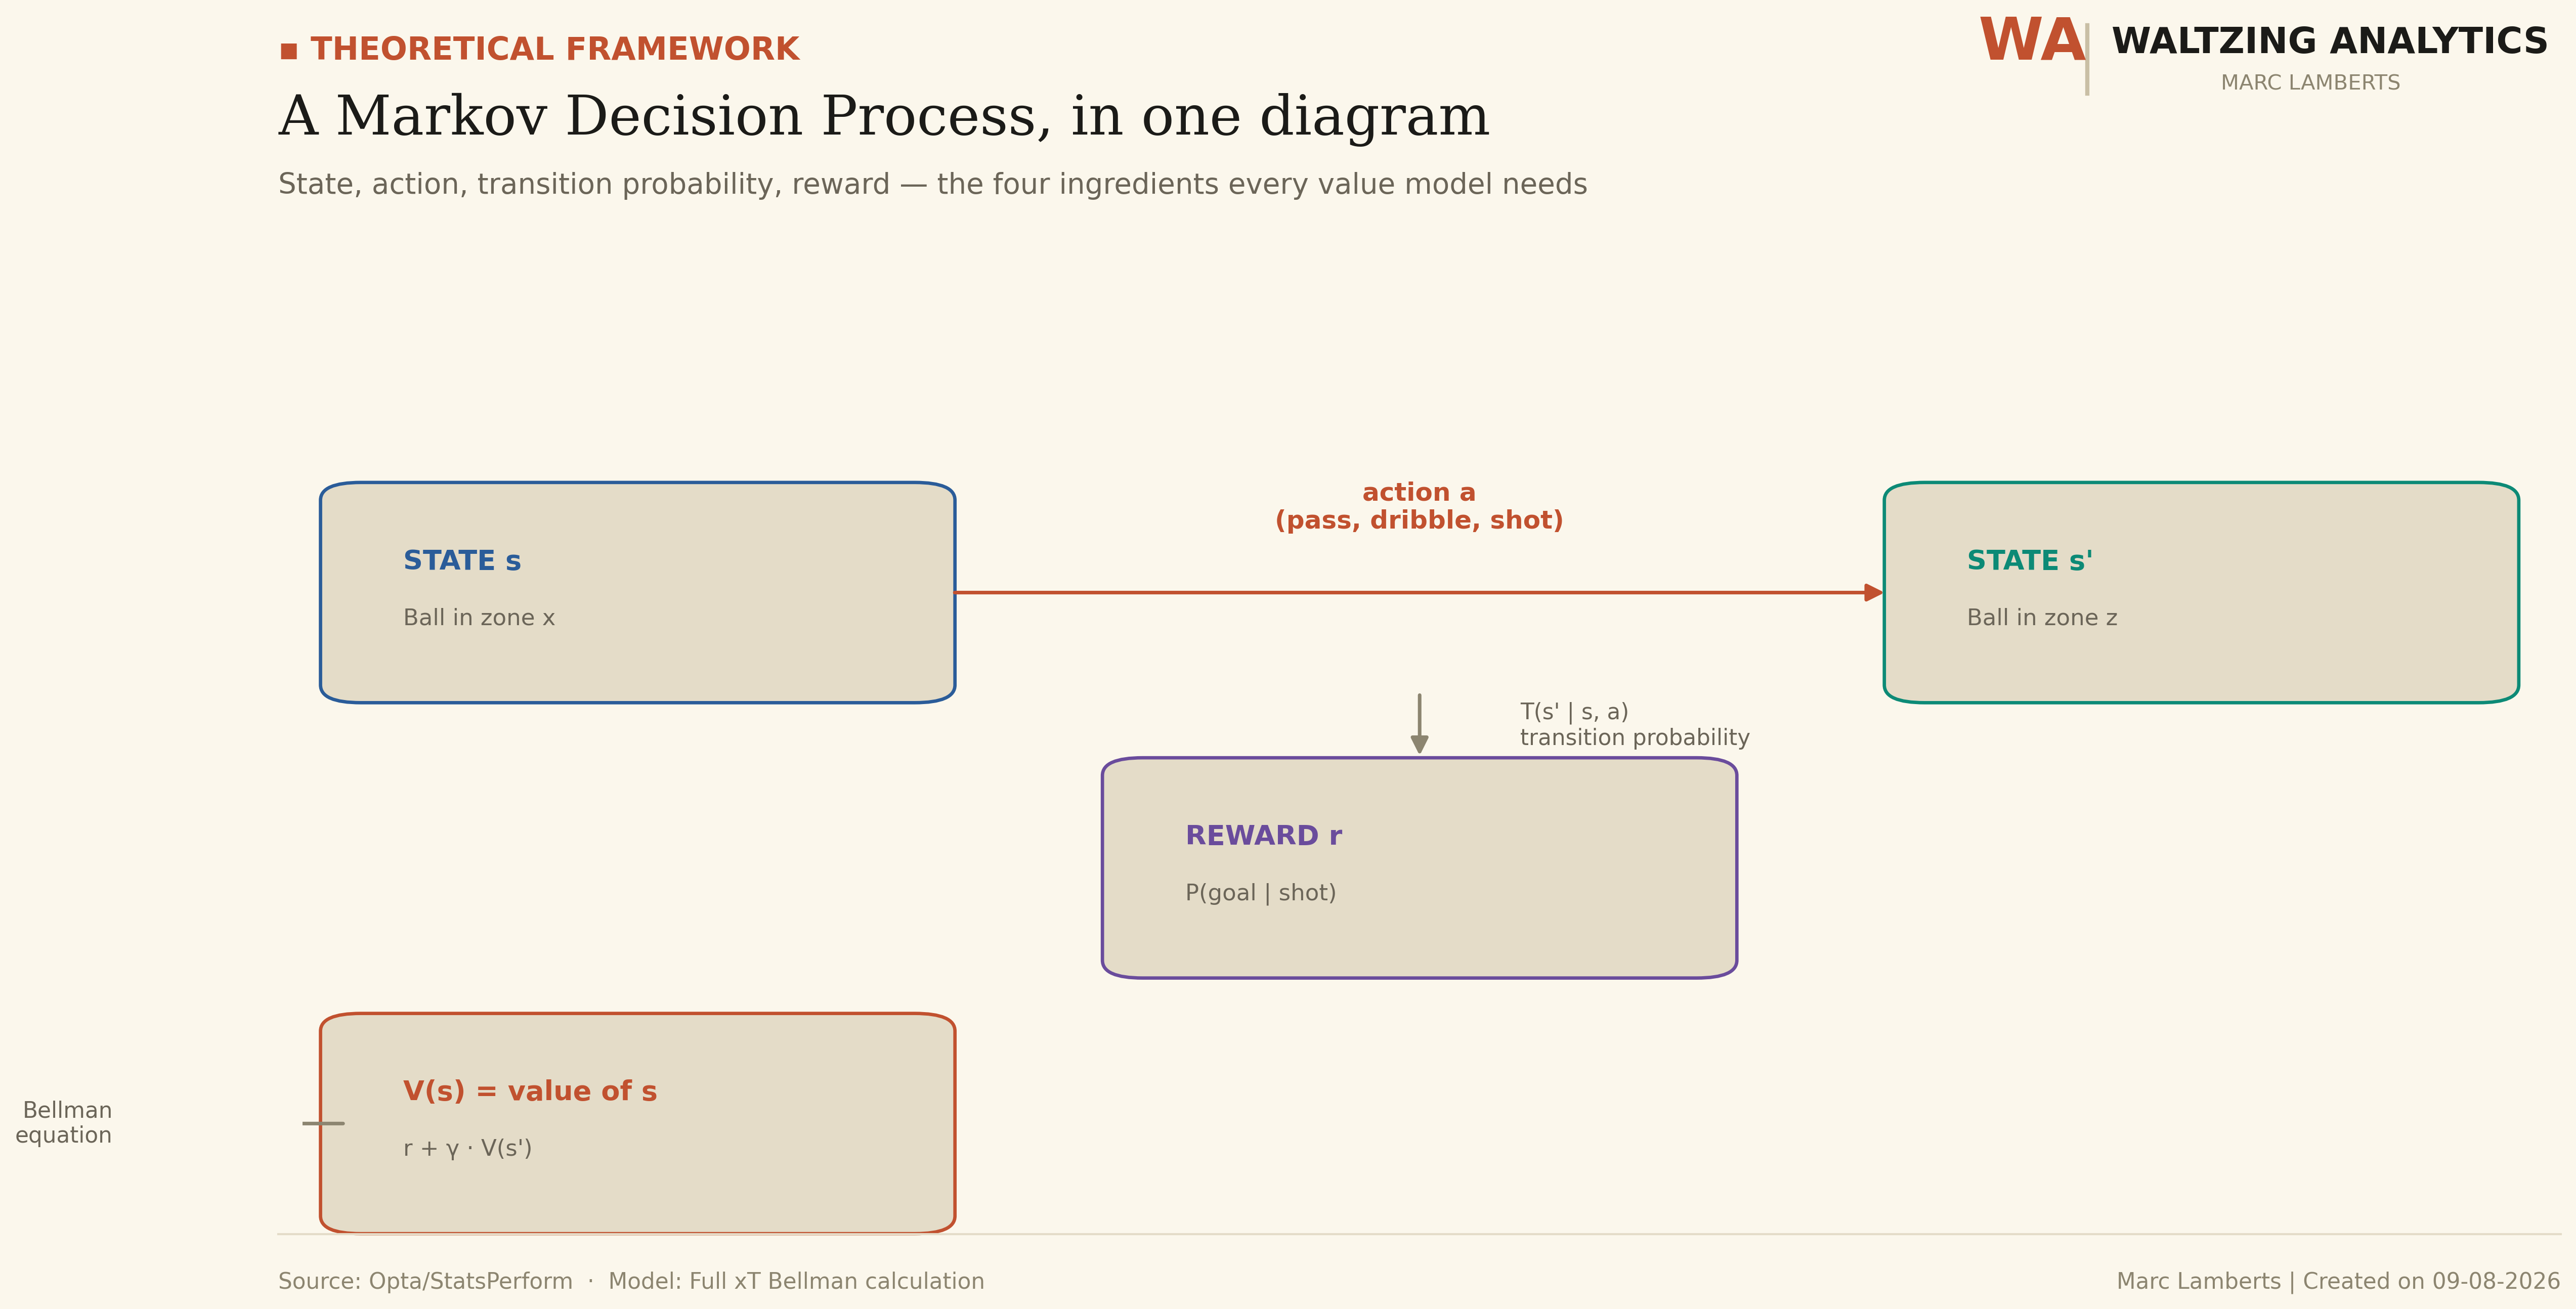
Diagram of a Markov Decision Process: state, action, transition probability and reward, with the Bellman equation
A Markov Decision Process, in one diagram — state, action, transition probability, reward: the four ingredients the xT and shot-clock models are built on.

Engineering validation: does it actually converge?

A fitted Bellman model is only trustworthy if the value iteration actually settles down — this is that check, not just an assumption.
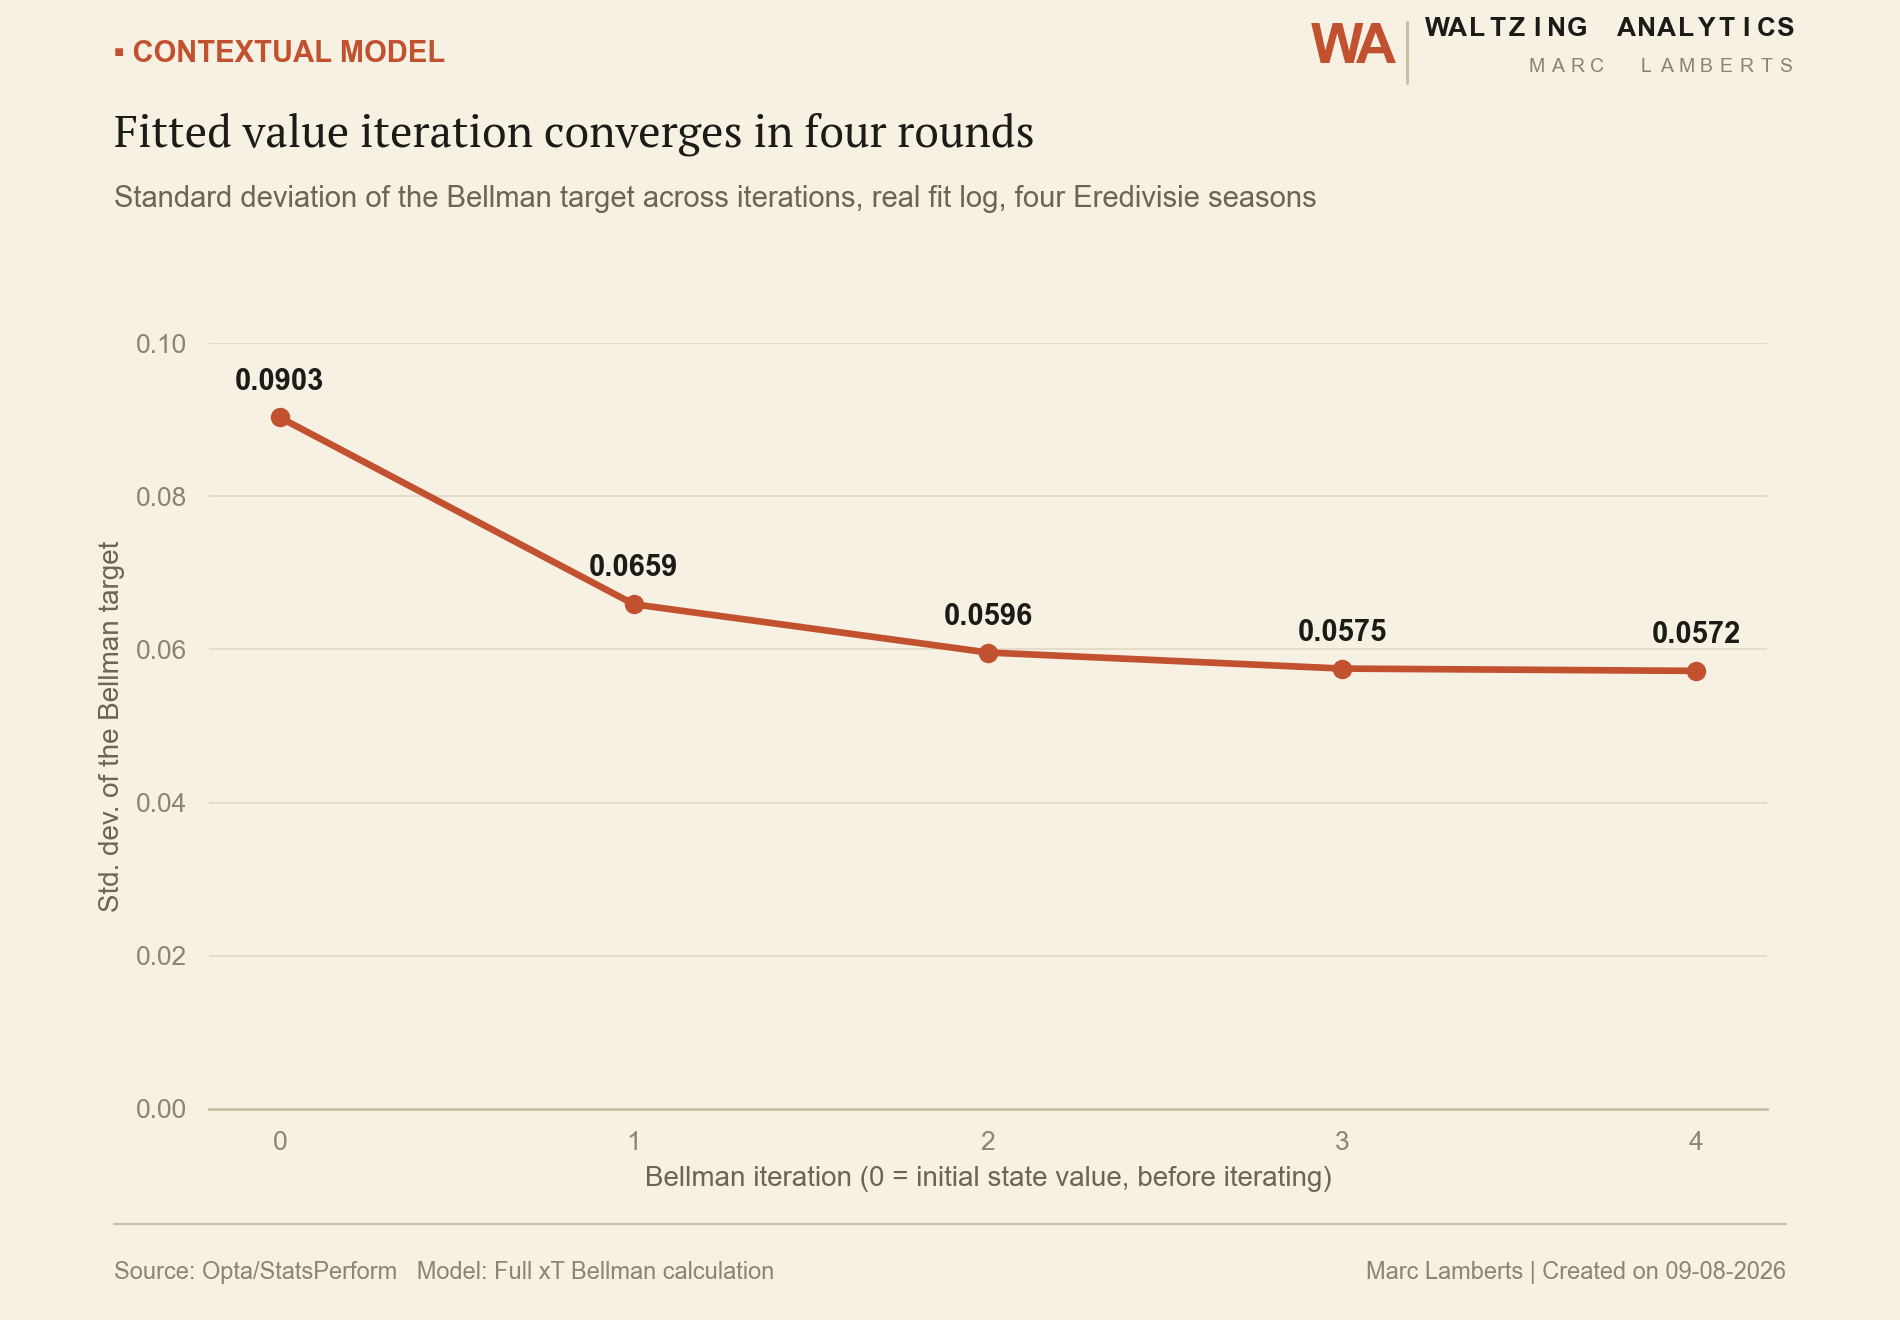
Line chart showing the standard deviation of the Bellman target decreasing and flattening across five iterations
Fitted value iteration converges in four rounds — standard deviation of the Bellman target across iterations, from the real fit log.

The full pipeline

All of the above, stitched into one repeatable run: from raw event state to a final action value.
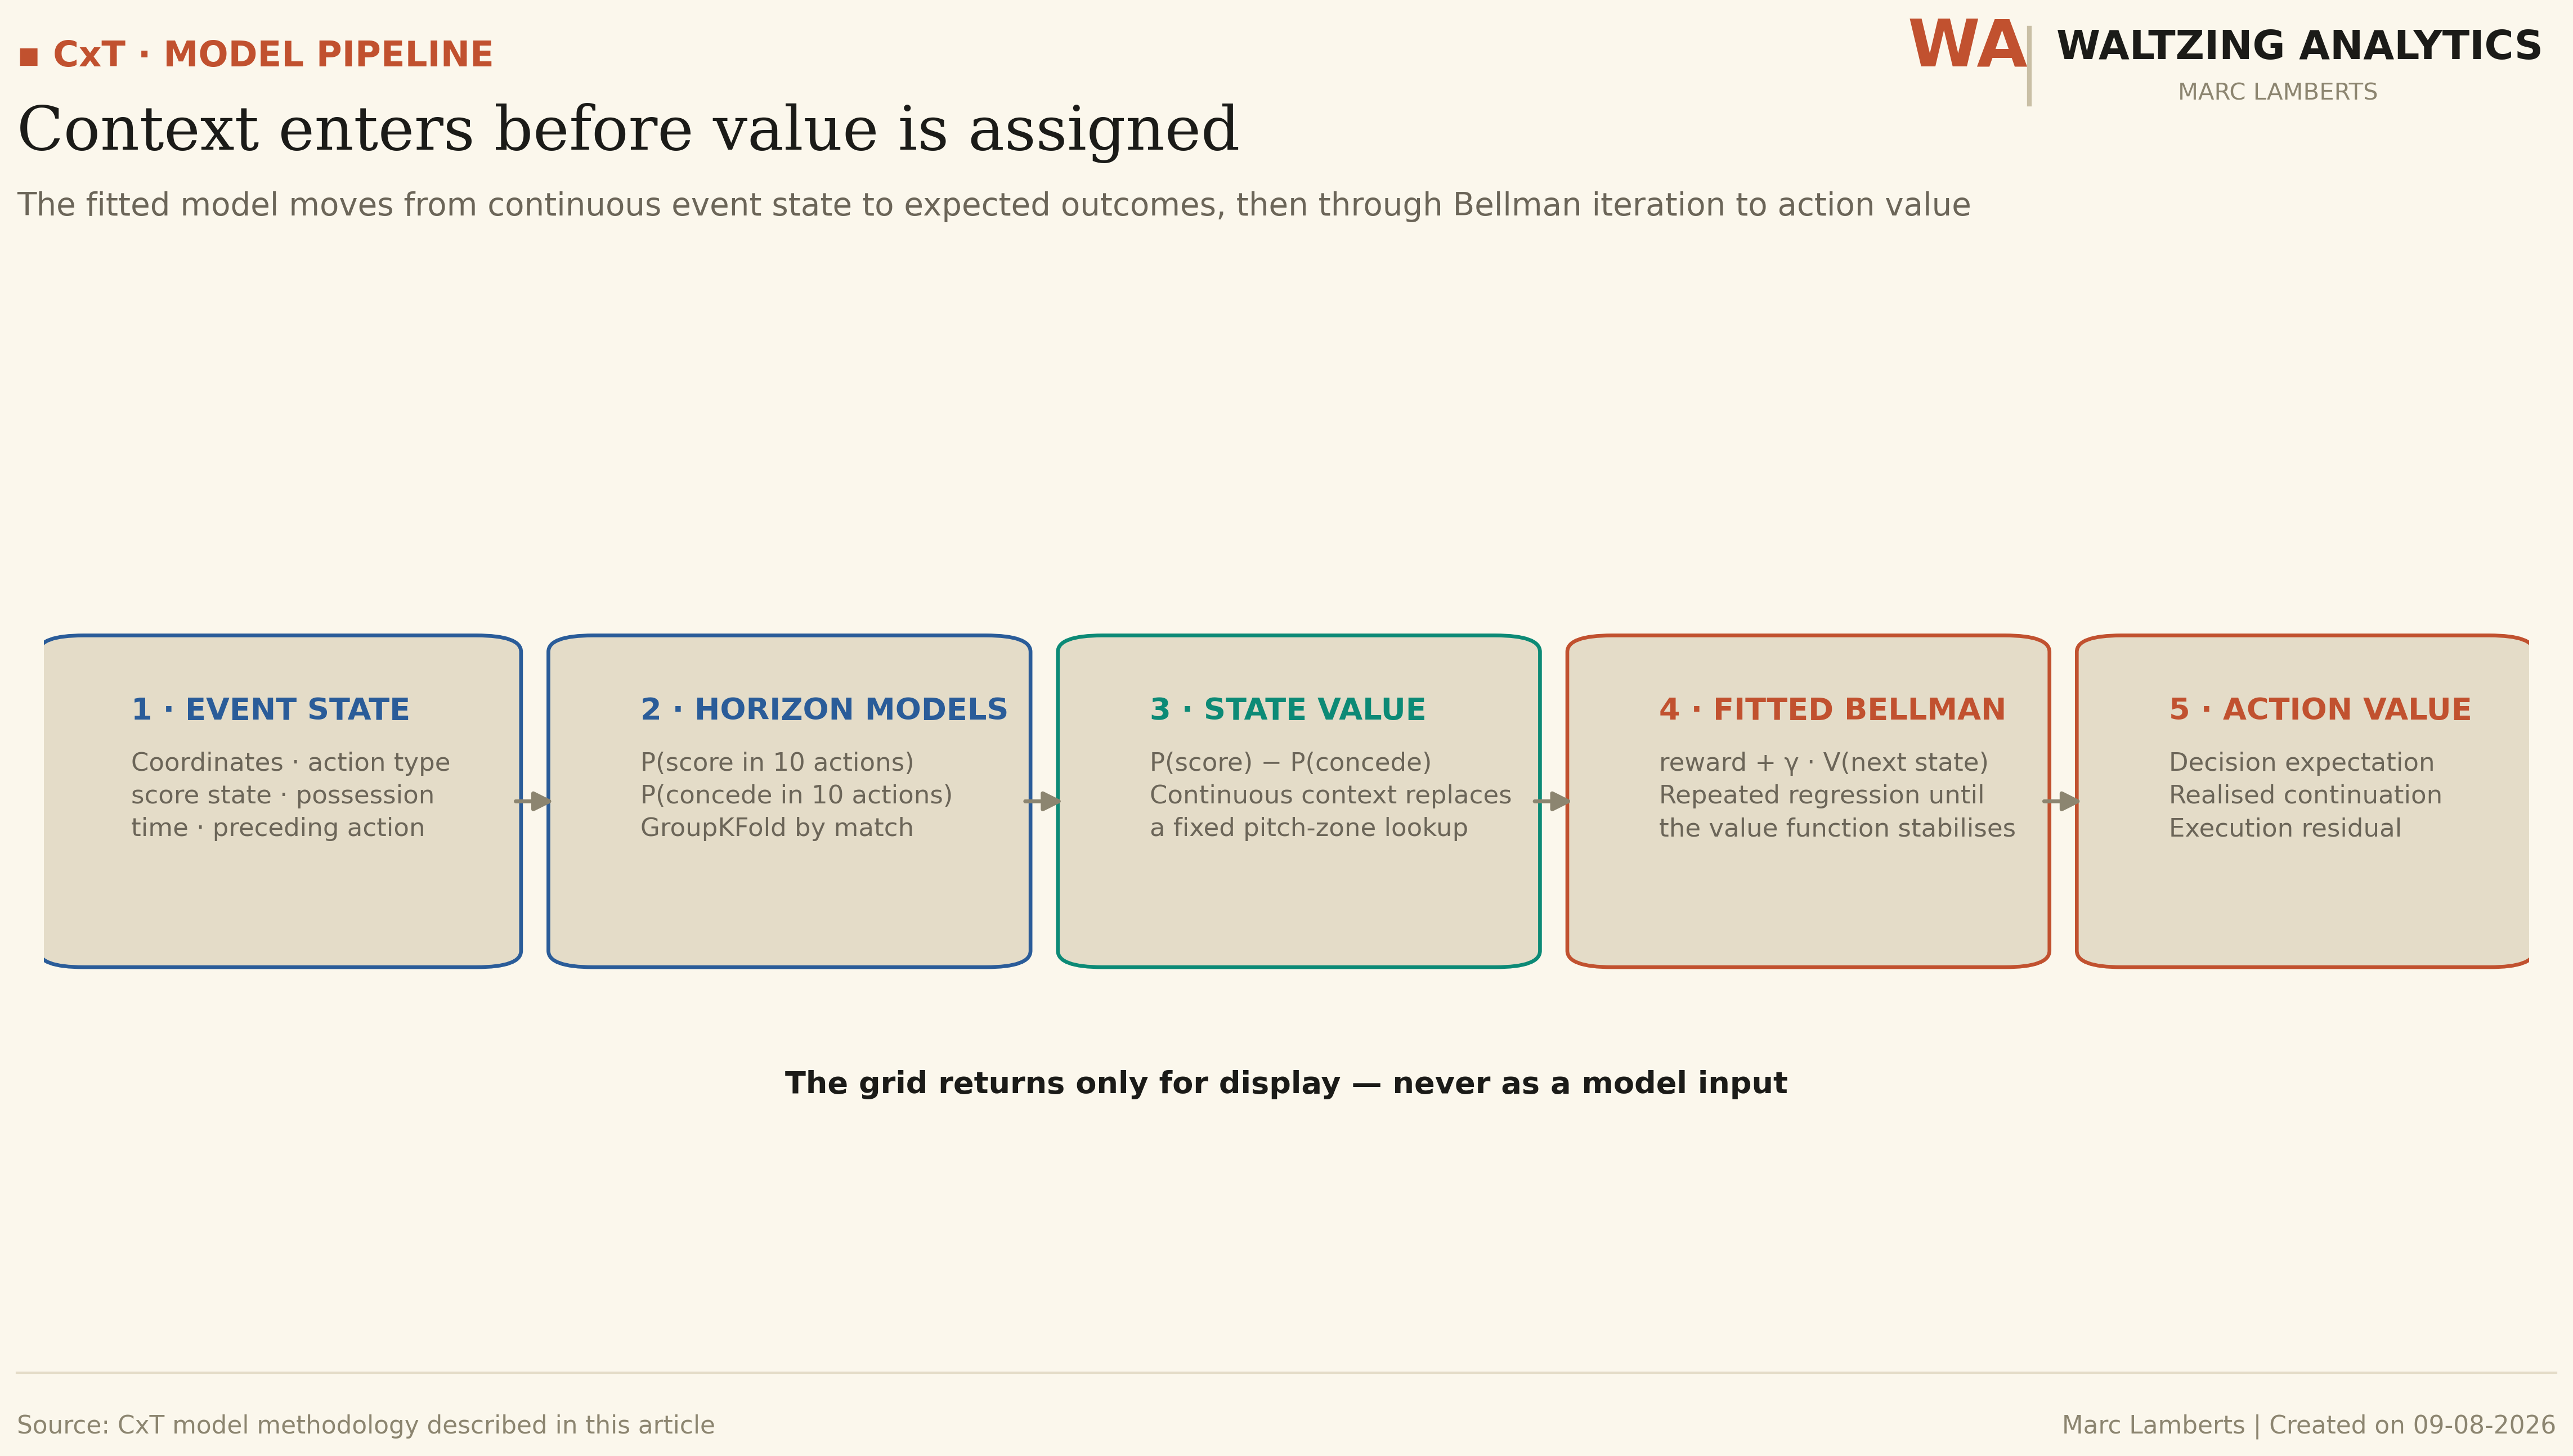
Five-step model pipeline diagram: event state, horizon models, state value, fitted Bellman, action value
Context enters before value is assigned — the five-step pipeline from raw event state through Bellman iteration to a final action value.

As a service

Commissioned, this becomes a pipeline built for your own data, not a one-off script. Automated ingestion of whichever event and tracking feeds you already have (Opta, StatsBomb, IMPECT, SkillCorner, Wyscout), models validated the way the ones above were and retrained on a schedule, and a dashboard or report your staff open without needing to touch the code underneath. Get in touch to talk through what your own data setup needs.

← Back to Services