3.2 / Services / Data Analysis

Data Analysis: Season & Match Breakdowns

A worked example of the analysis behind the Data Analysis tile, at two levels: season-long league patterns and single-match breakdowns. Built on Opta/StatsPerform event data, styled in the same Meridian house style used across every report.

Season-level: Eredivisie goal kicks

Every goal kick in the Eredivisie since 2022/23, broken down by where it lands, how often it's kept, and which goalkeepers are most reliable under a short buildup.
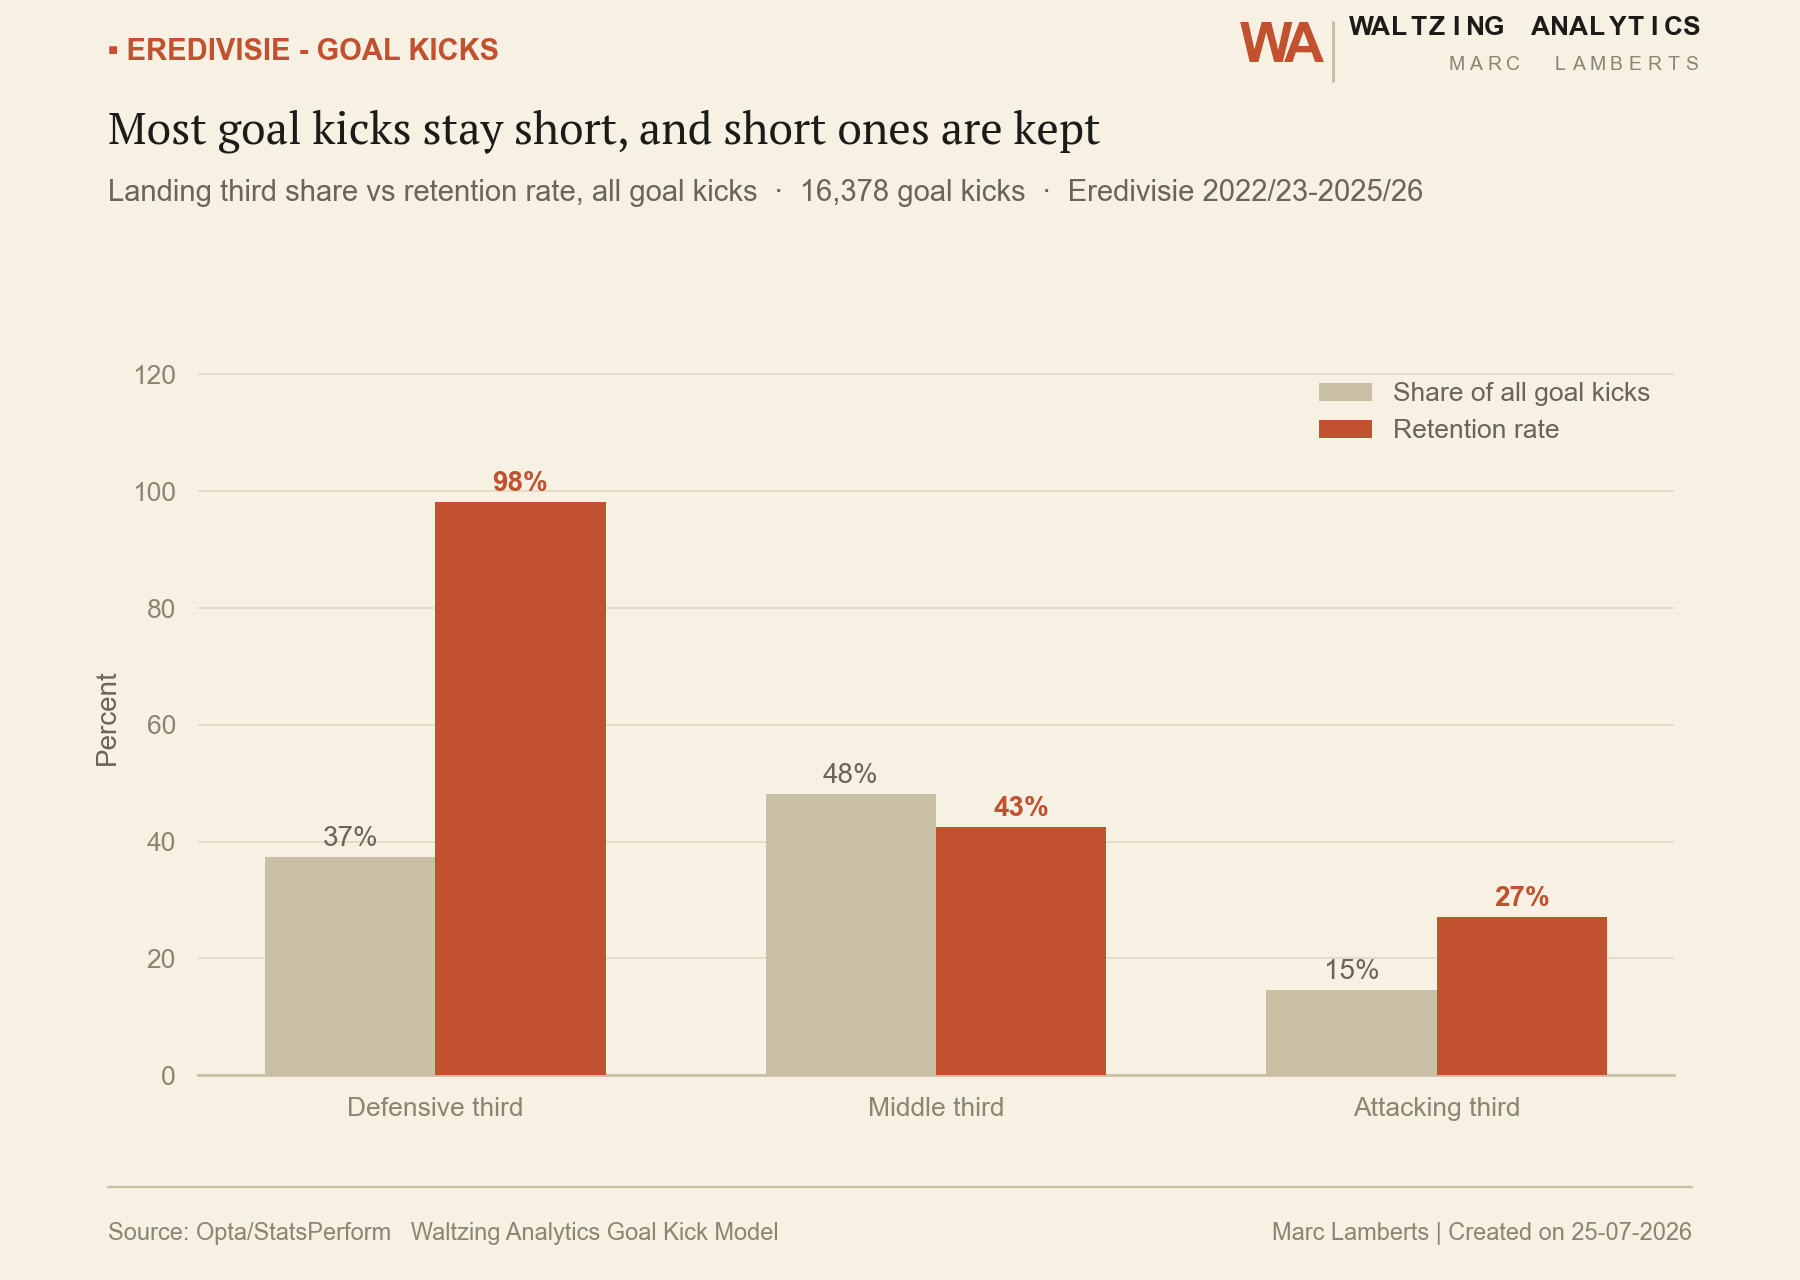
Bar chart: share of Eredivisie goal kicks by pitch third versus retention rate, showing most goal kicks stay short and short ones are kept
Most goal kicks stay short, and short ones are kept — landing-third share vs. retention rate across 16,378 Eredivisie goal kicks, 2022/23–2025/26.
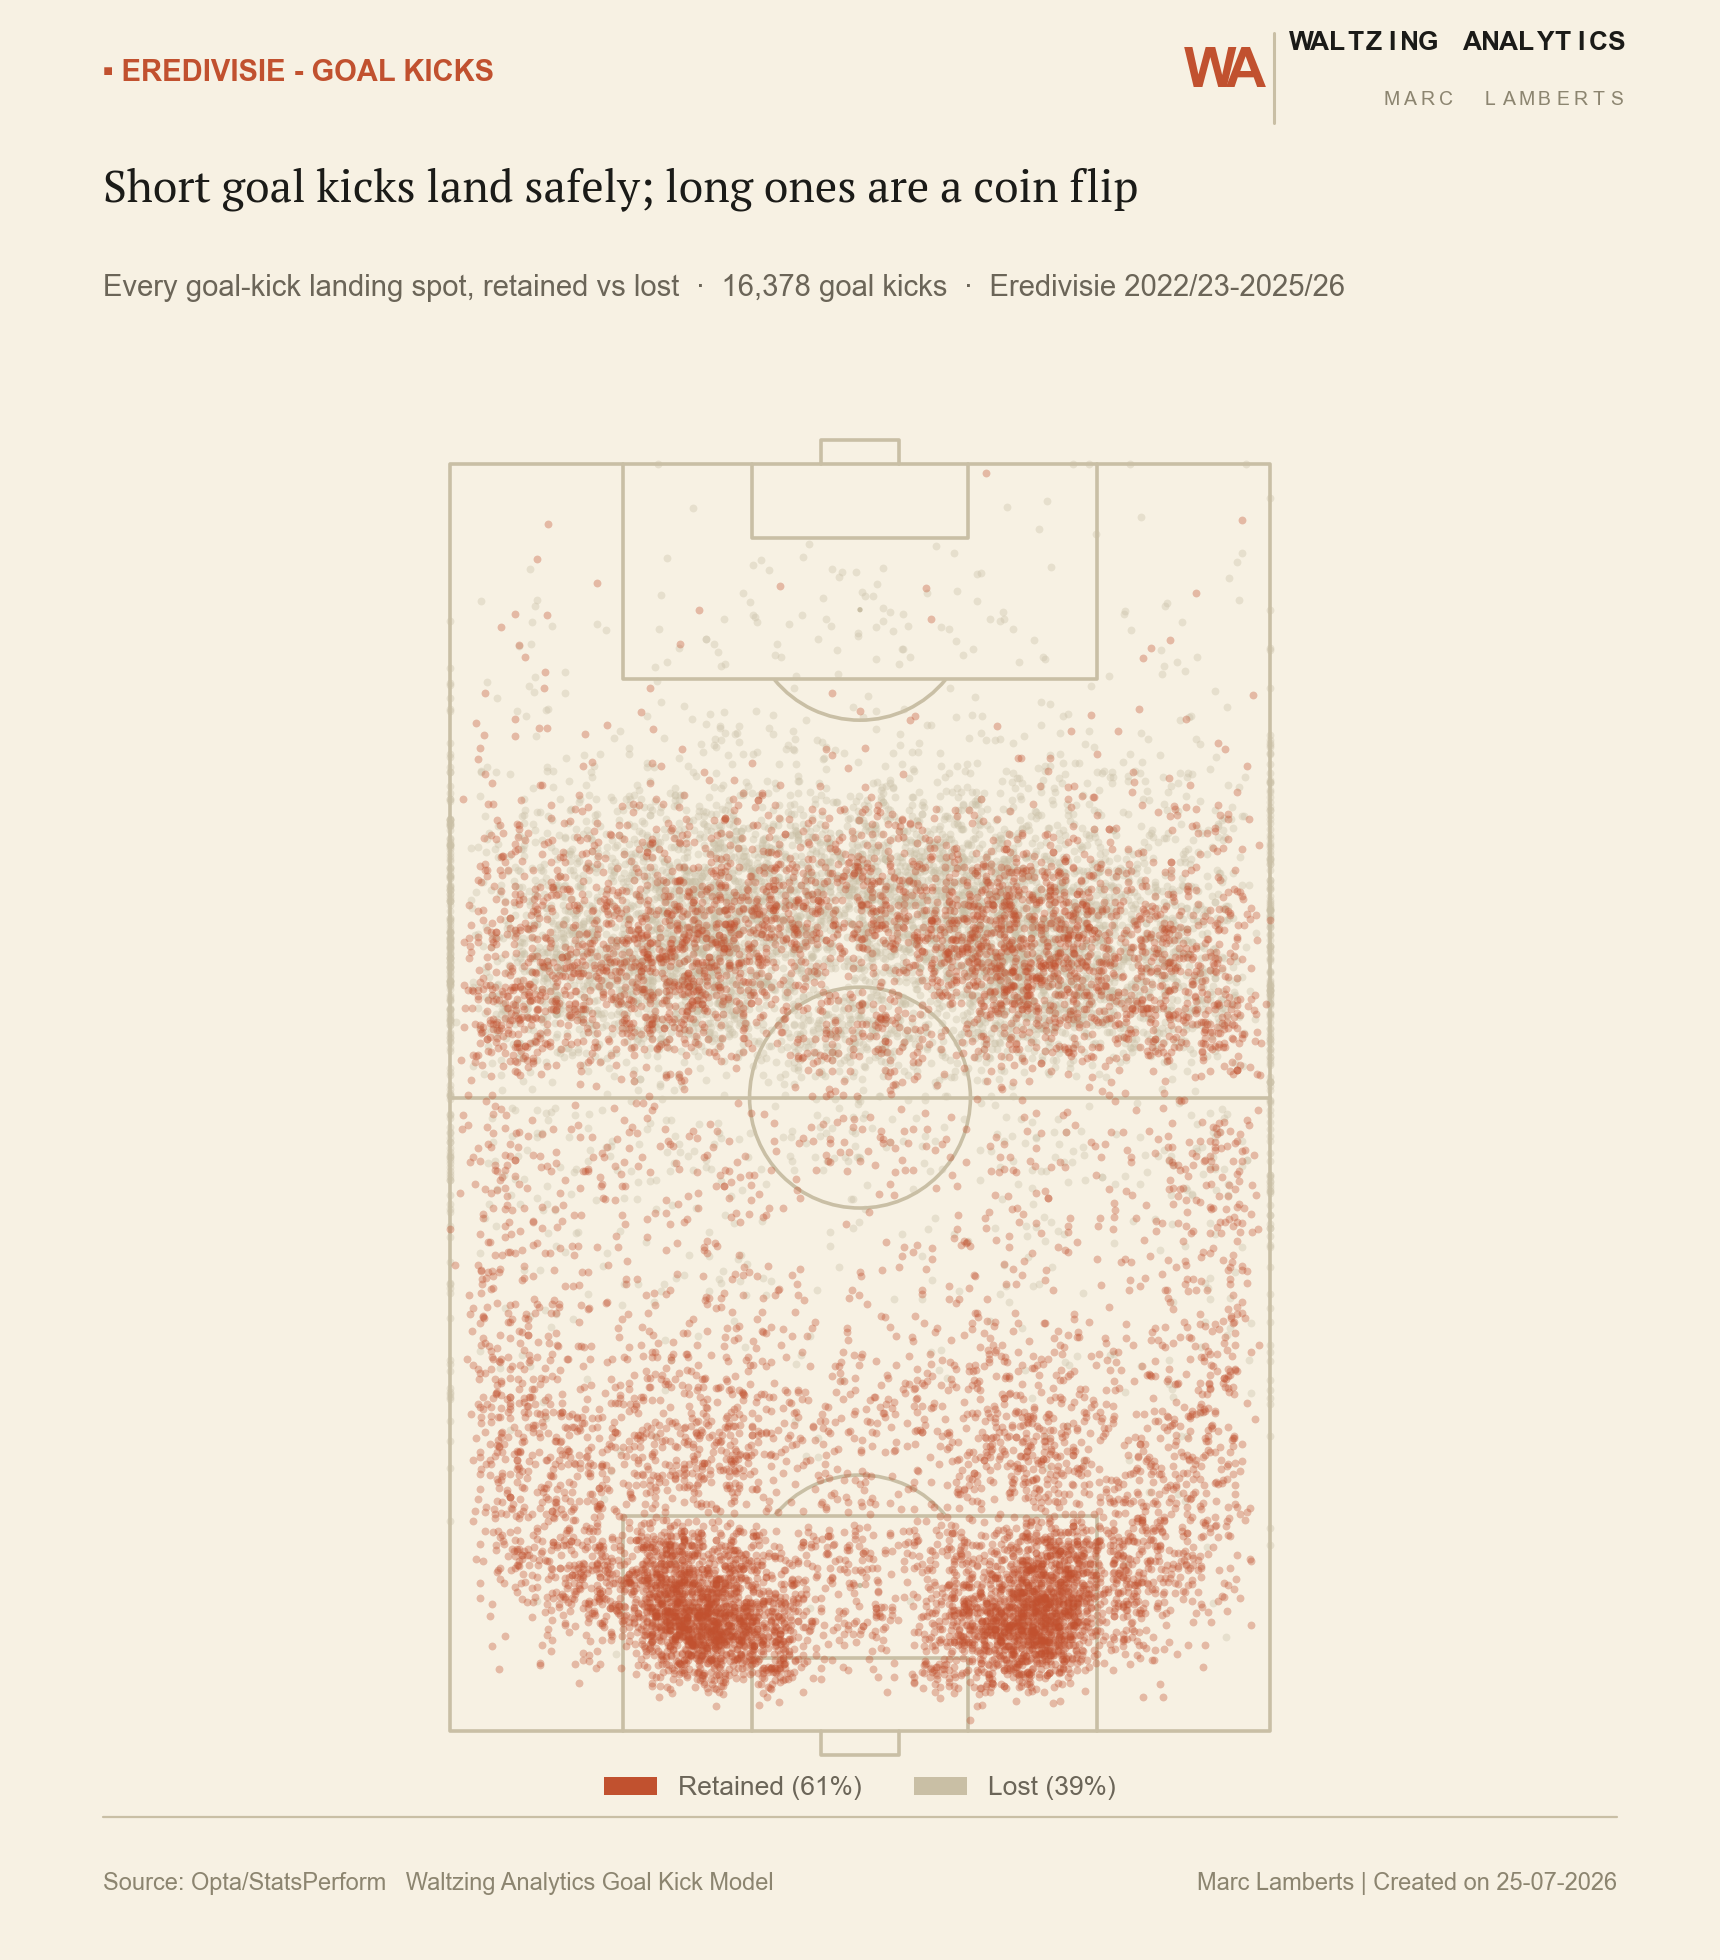
Pitch scatter plot of every Eredivisie goal-kick landing spot, colored by whether possession was retained or lost
Short goal kicks land safely; long ones are a coin flip — every landing spot plotted, retained vs. lost.
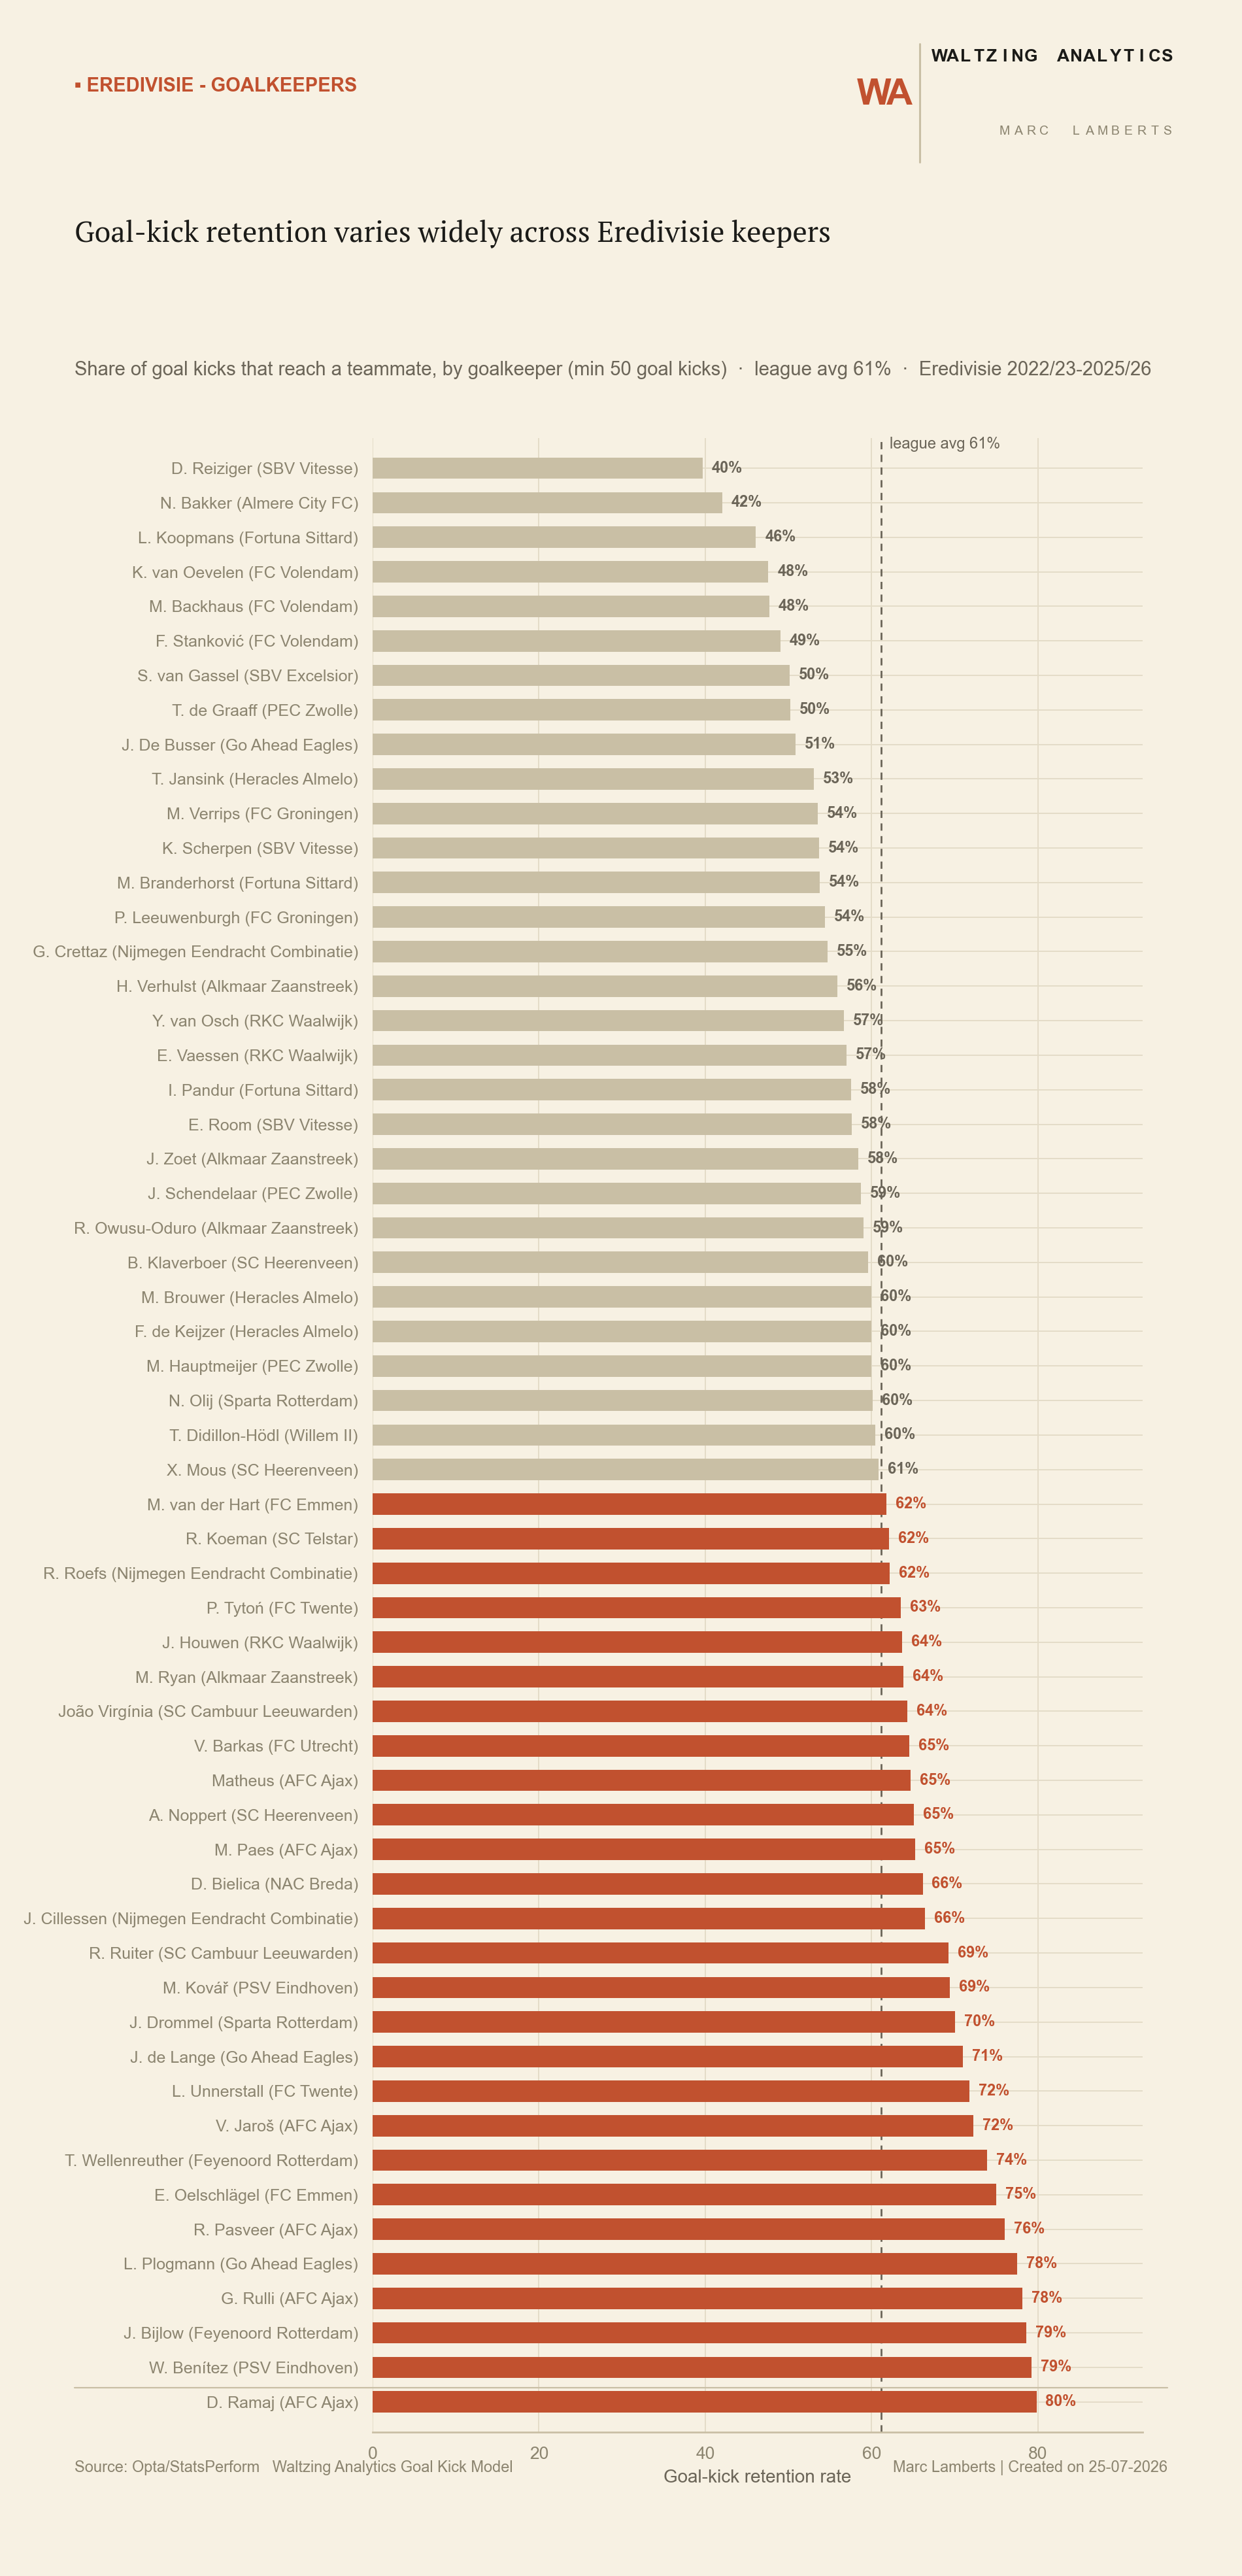
Horizontal bar chart ranking every Eredivisie goalkeeper by goal-kick retention rate
Goal-kick retention varies widely across Eredivisie keepers — every keeper with at least 50 goal kicks, ranked by share reaching a teammate.

Match-level: shot maps, xG/xT flow & passing networks

The same event data broken down for a single match instead of a season — Vojvodina 1–4 Ajax, UECL qualifying, 23 Jul 2026. This is the level of detail a post-match report works from.
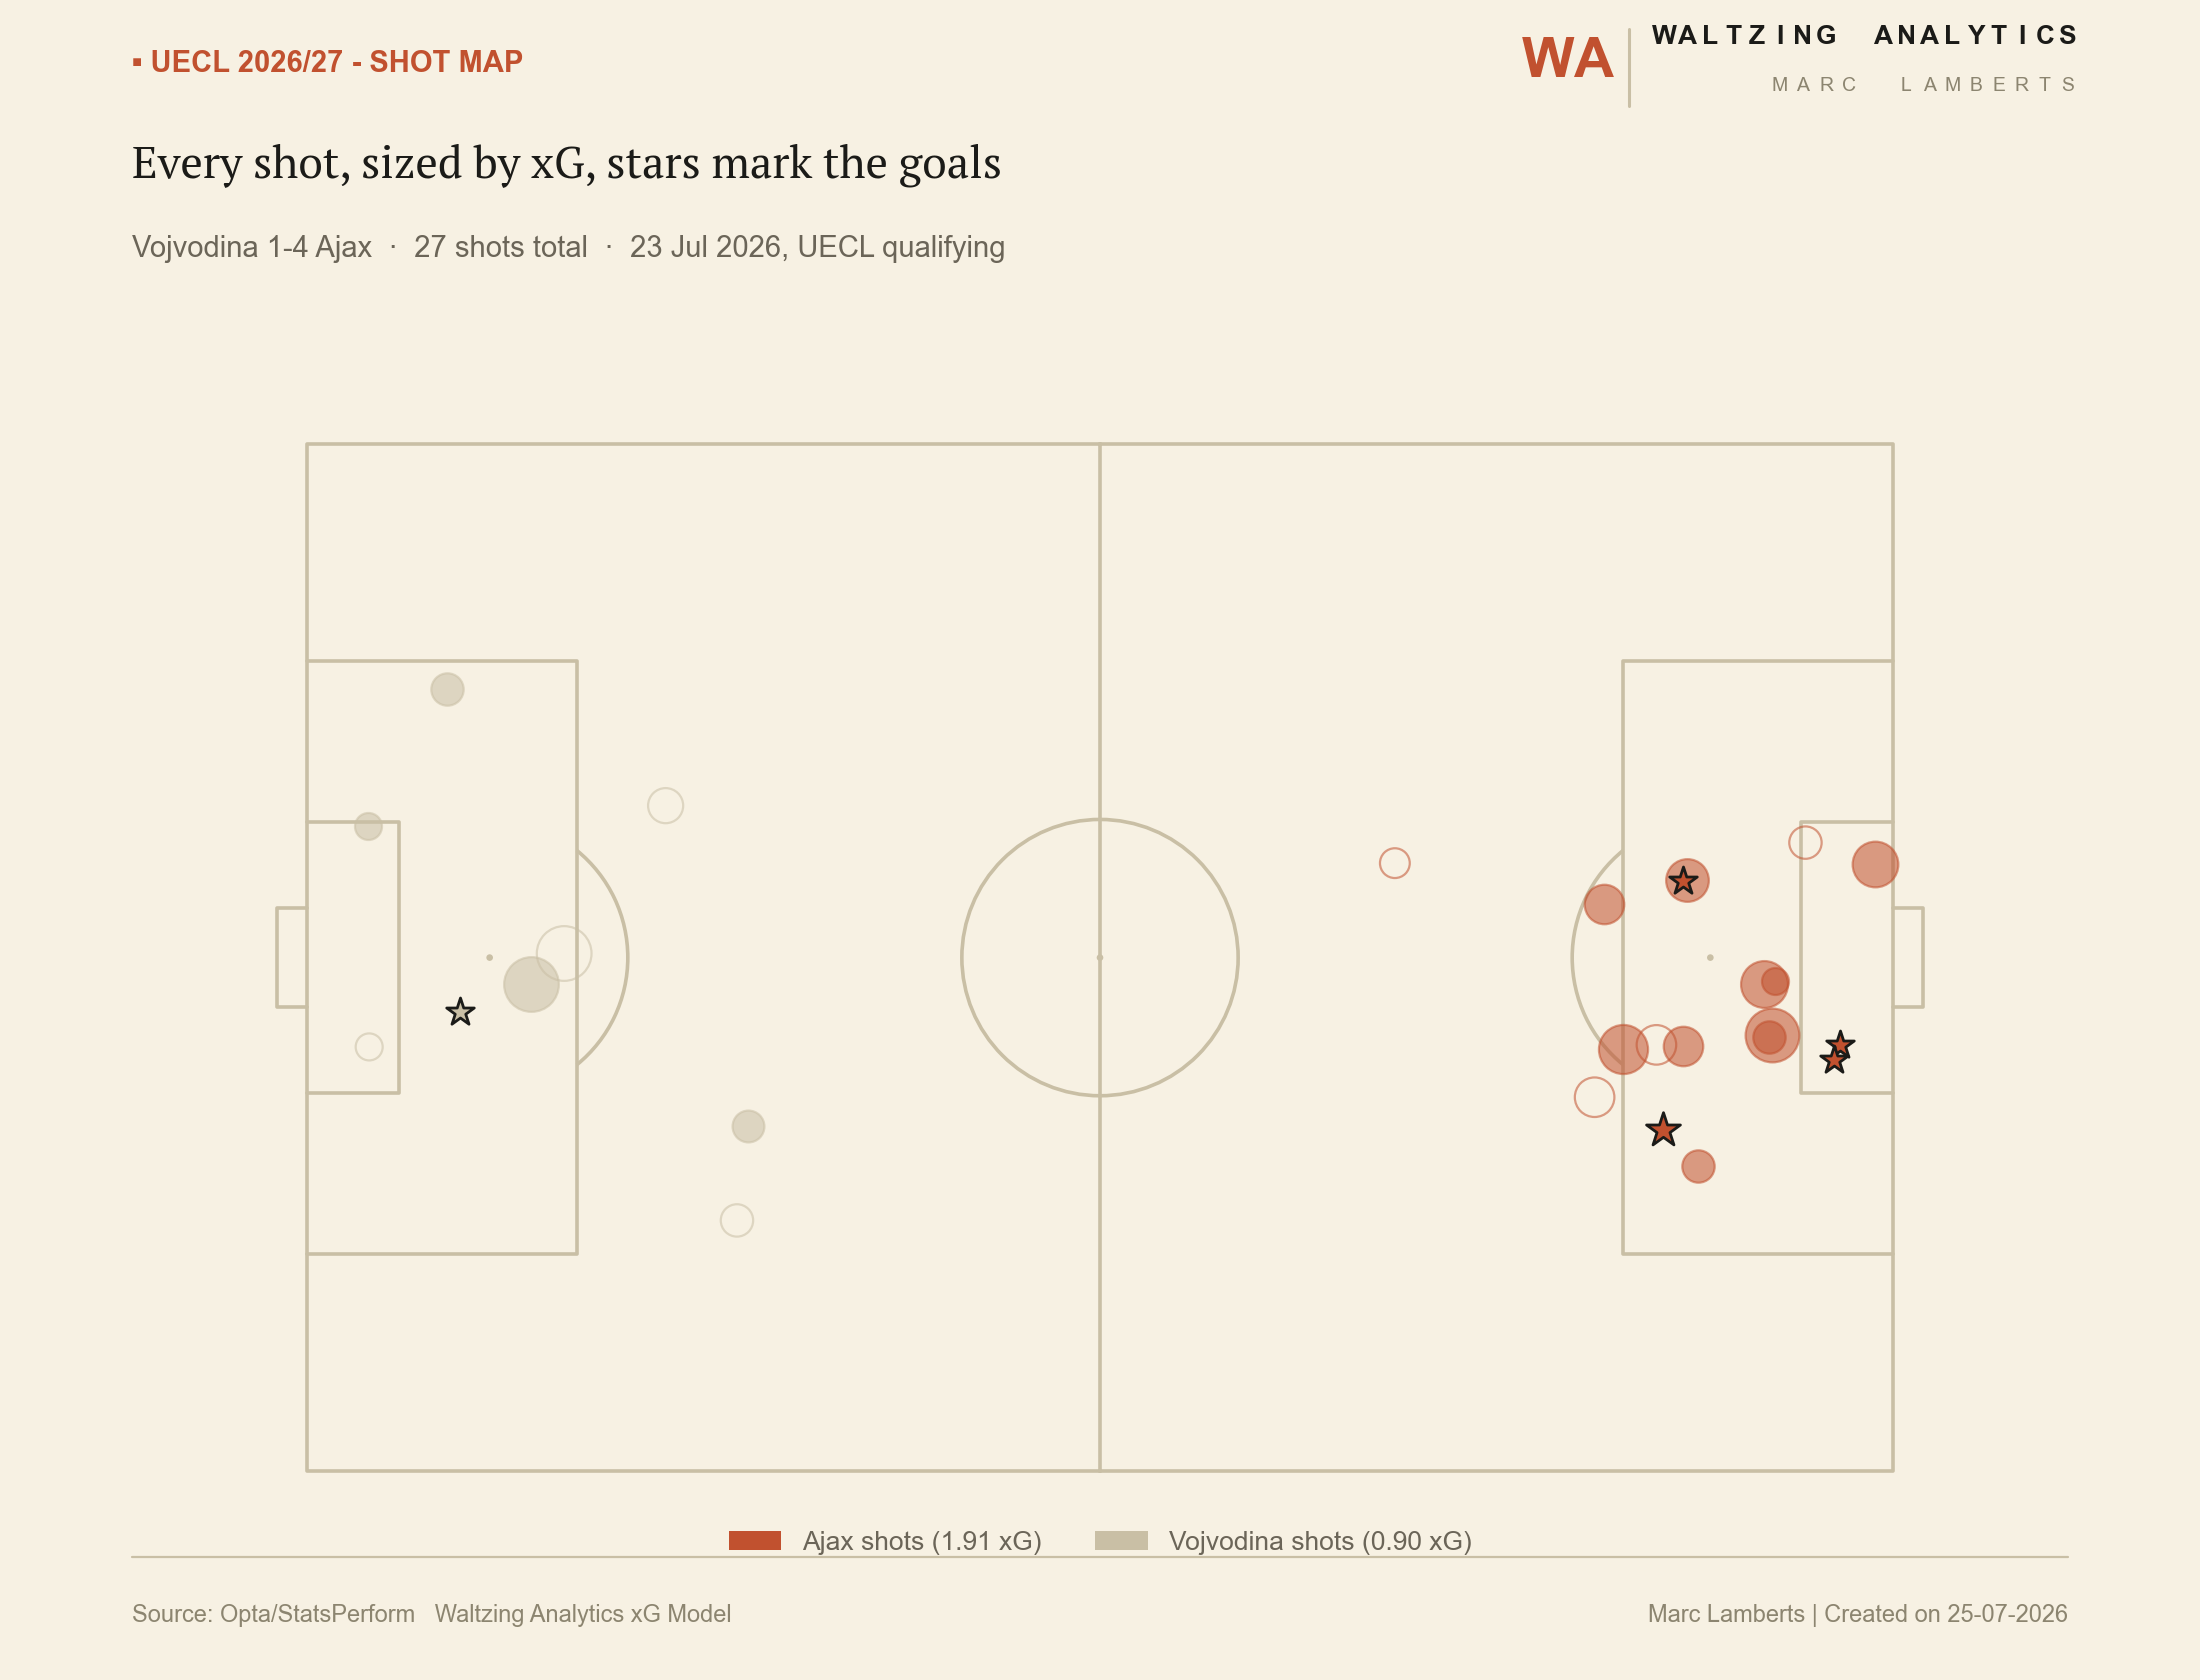
Shot map of Vojvodina versus Ajax, every shot sized by xG, stars marking goals
Every shot, sized by xG, stars mark the goals — Vojvodina 1–4 Ajax, 27 shots total.
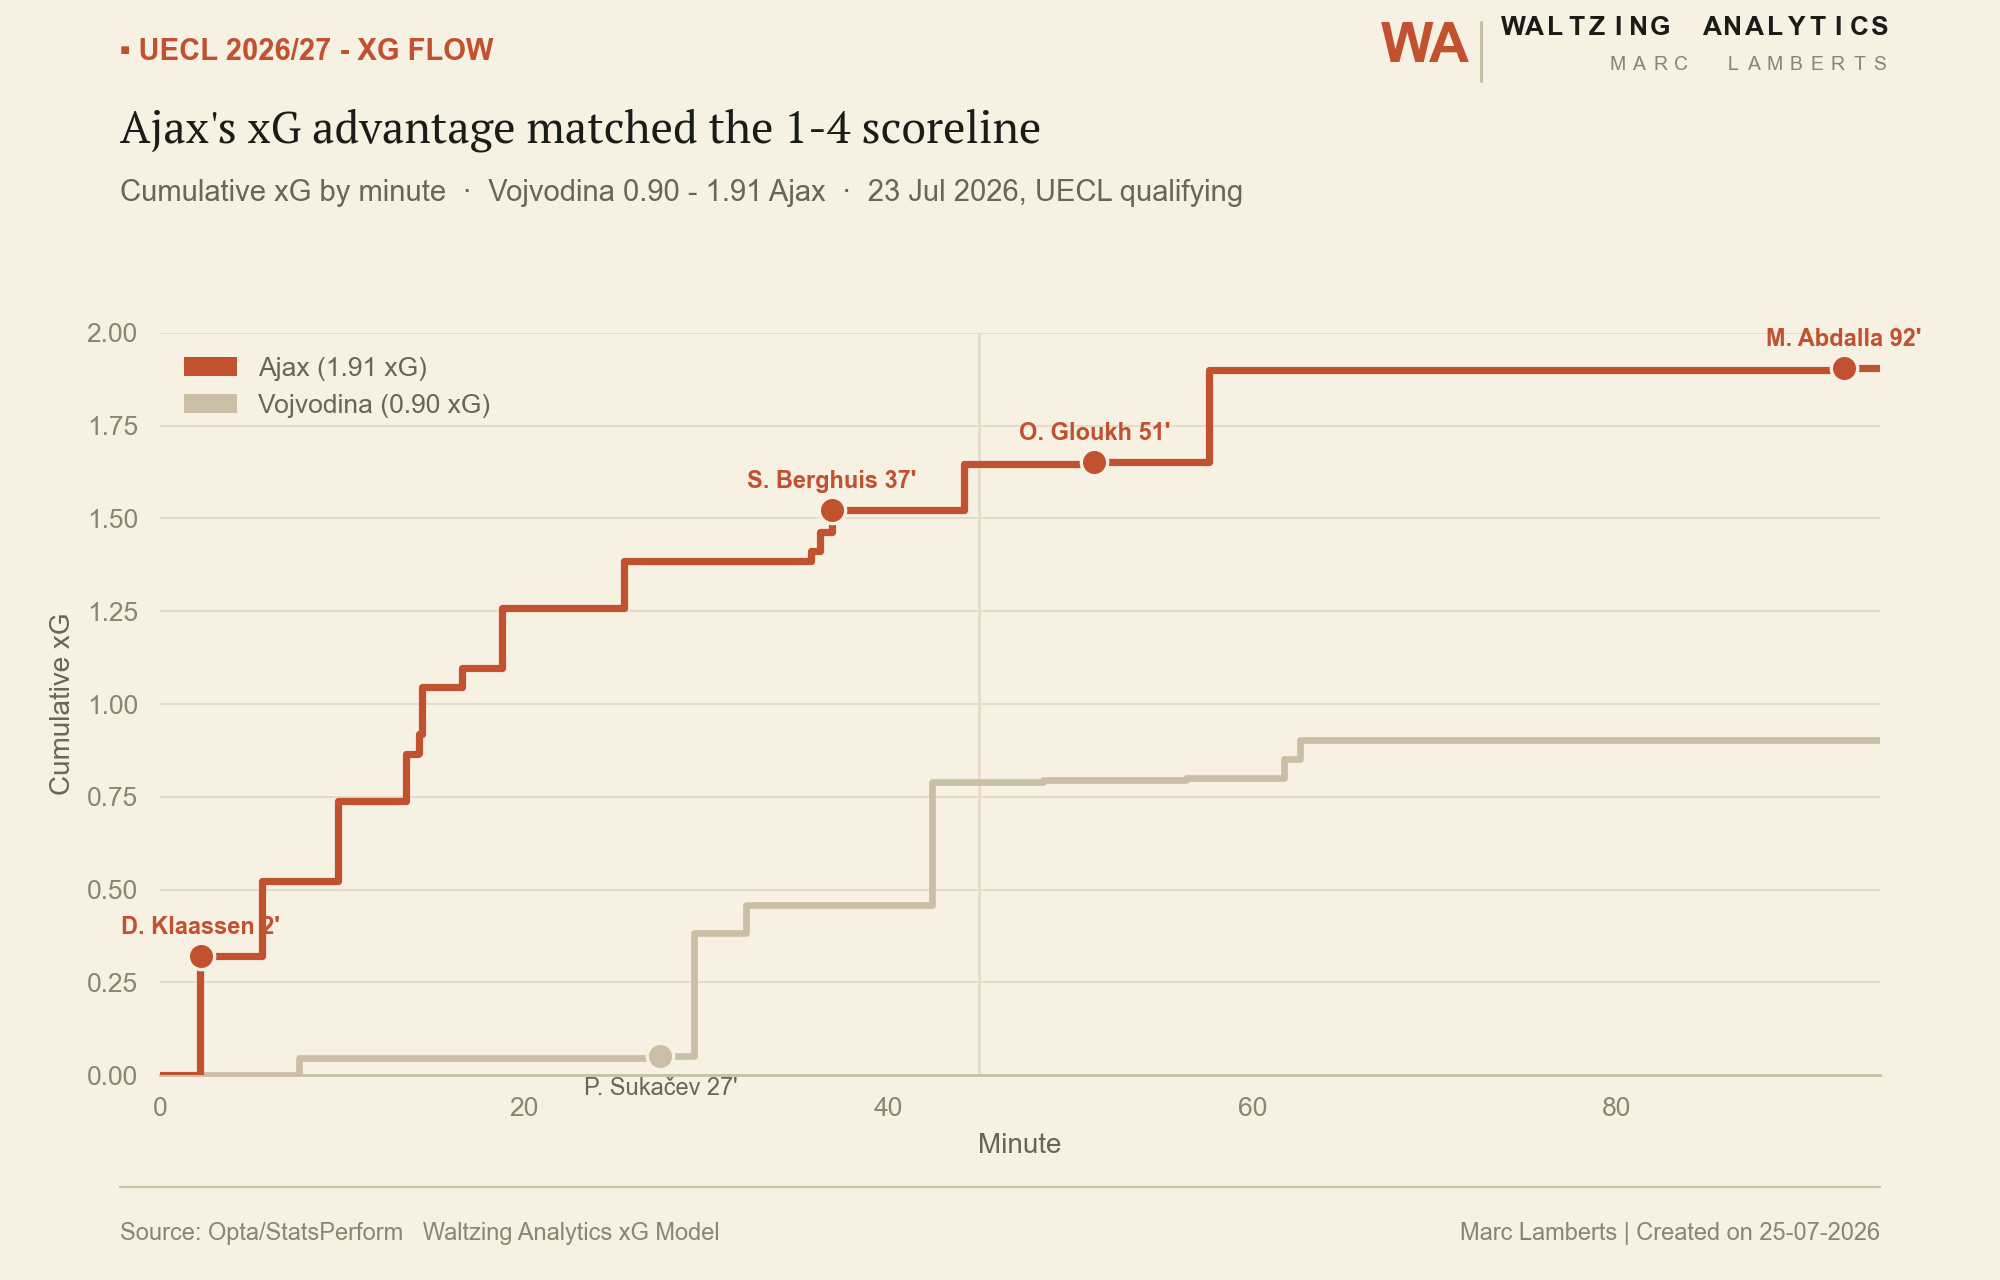
Cumulative xG flow chart for Vojvodina versus Ajax by minute
Ajax's xG advantage matched the 1–4 scoreline — cumulative xG by minute, with each goal marked.
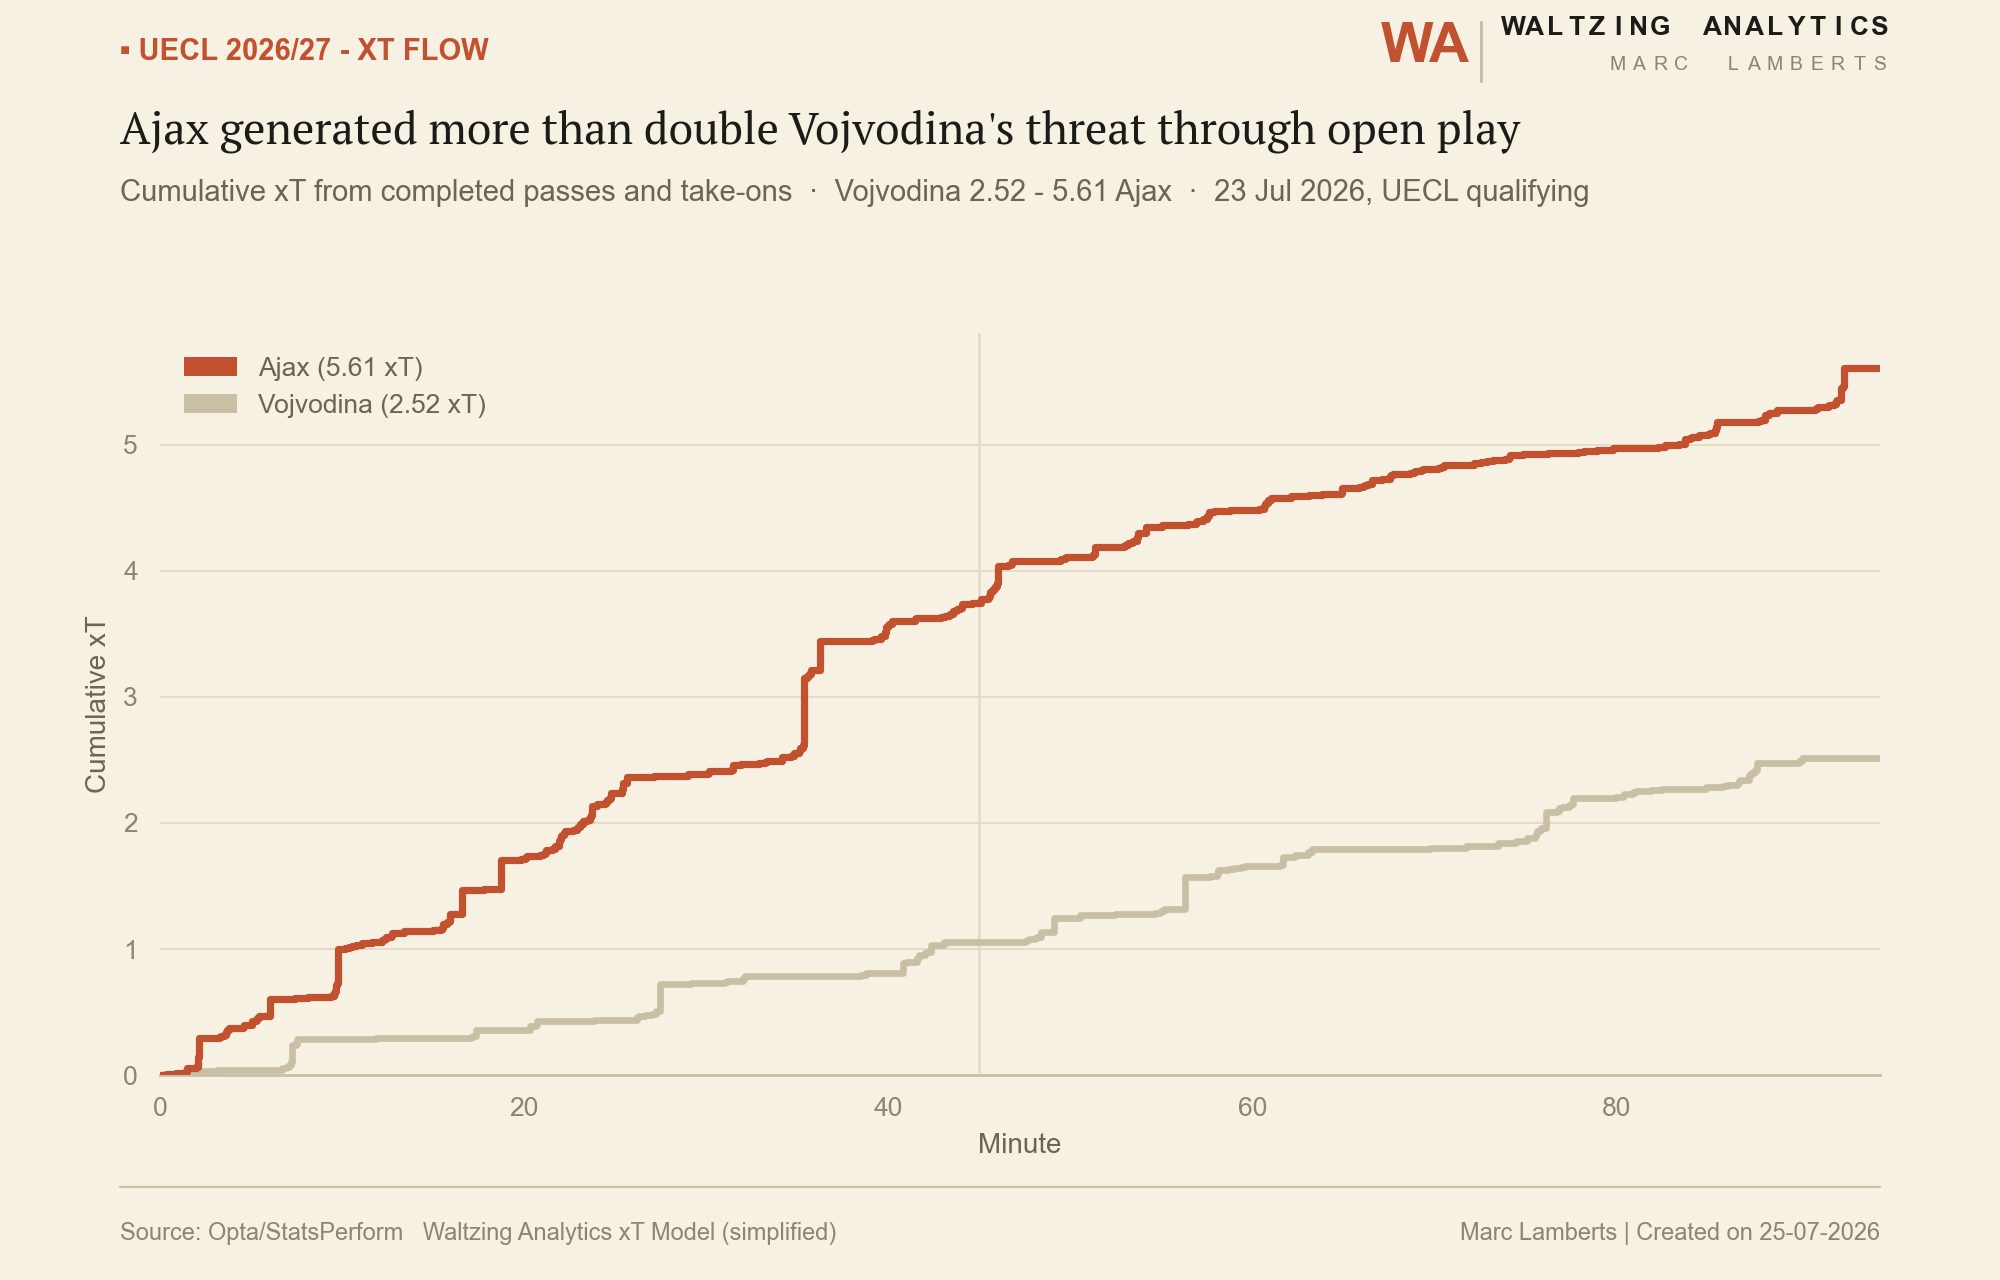
Cumulative expected threat (xT) flow chart for Vojvodina versus Ajax by minute
Ajax generated more than double Vojvodina's threat through open play — cumulative xT from completed passes and take-ons.
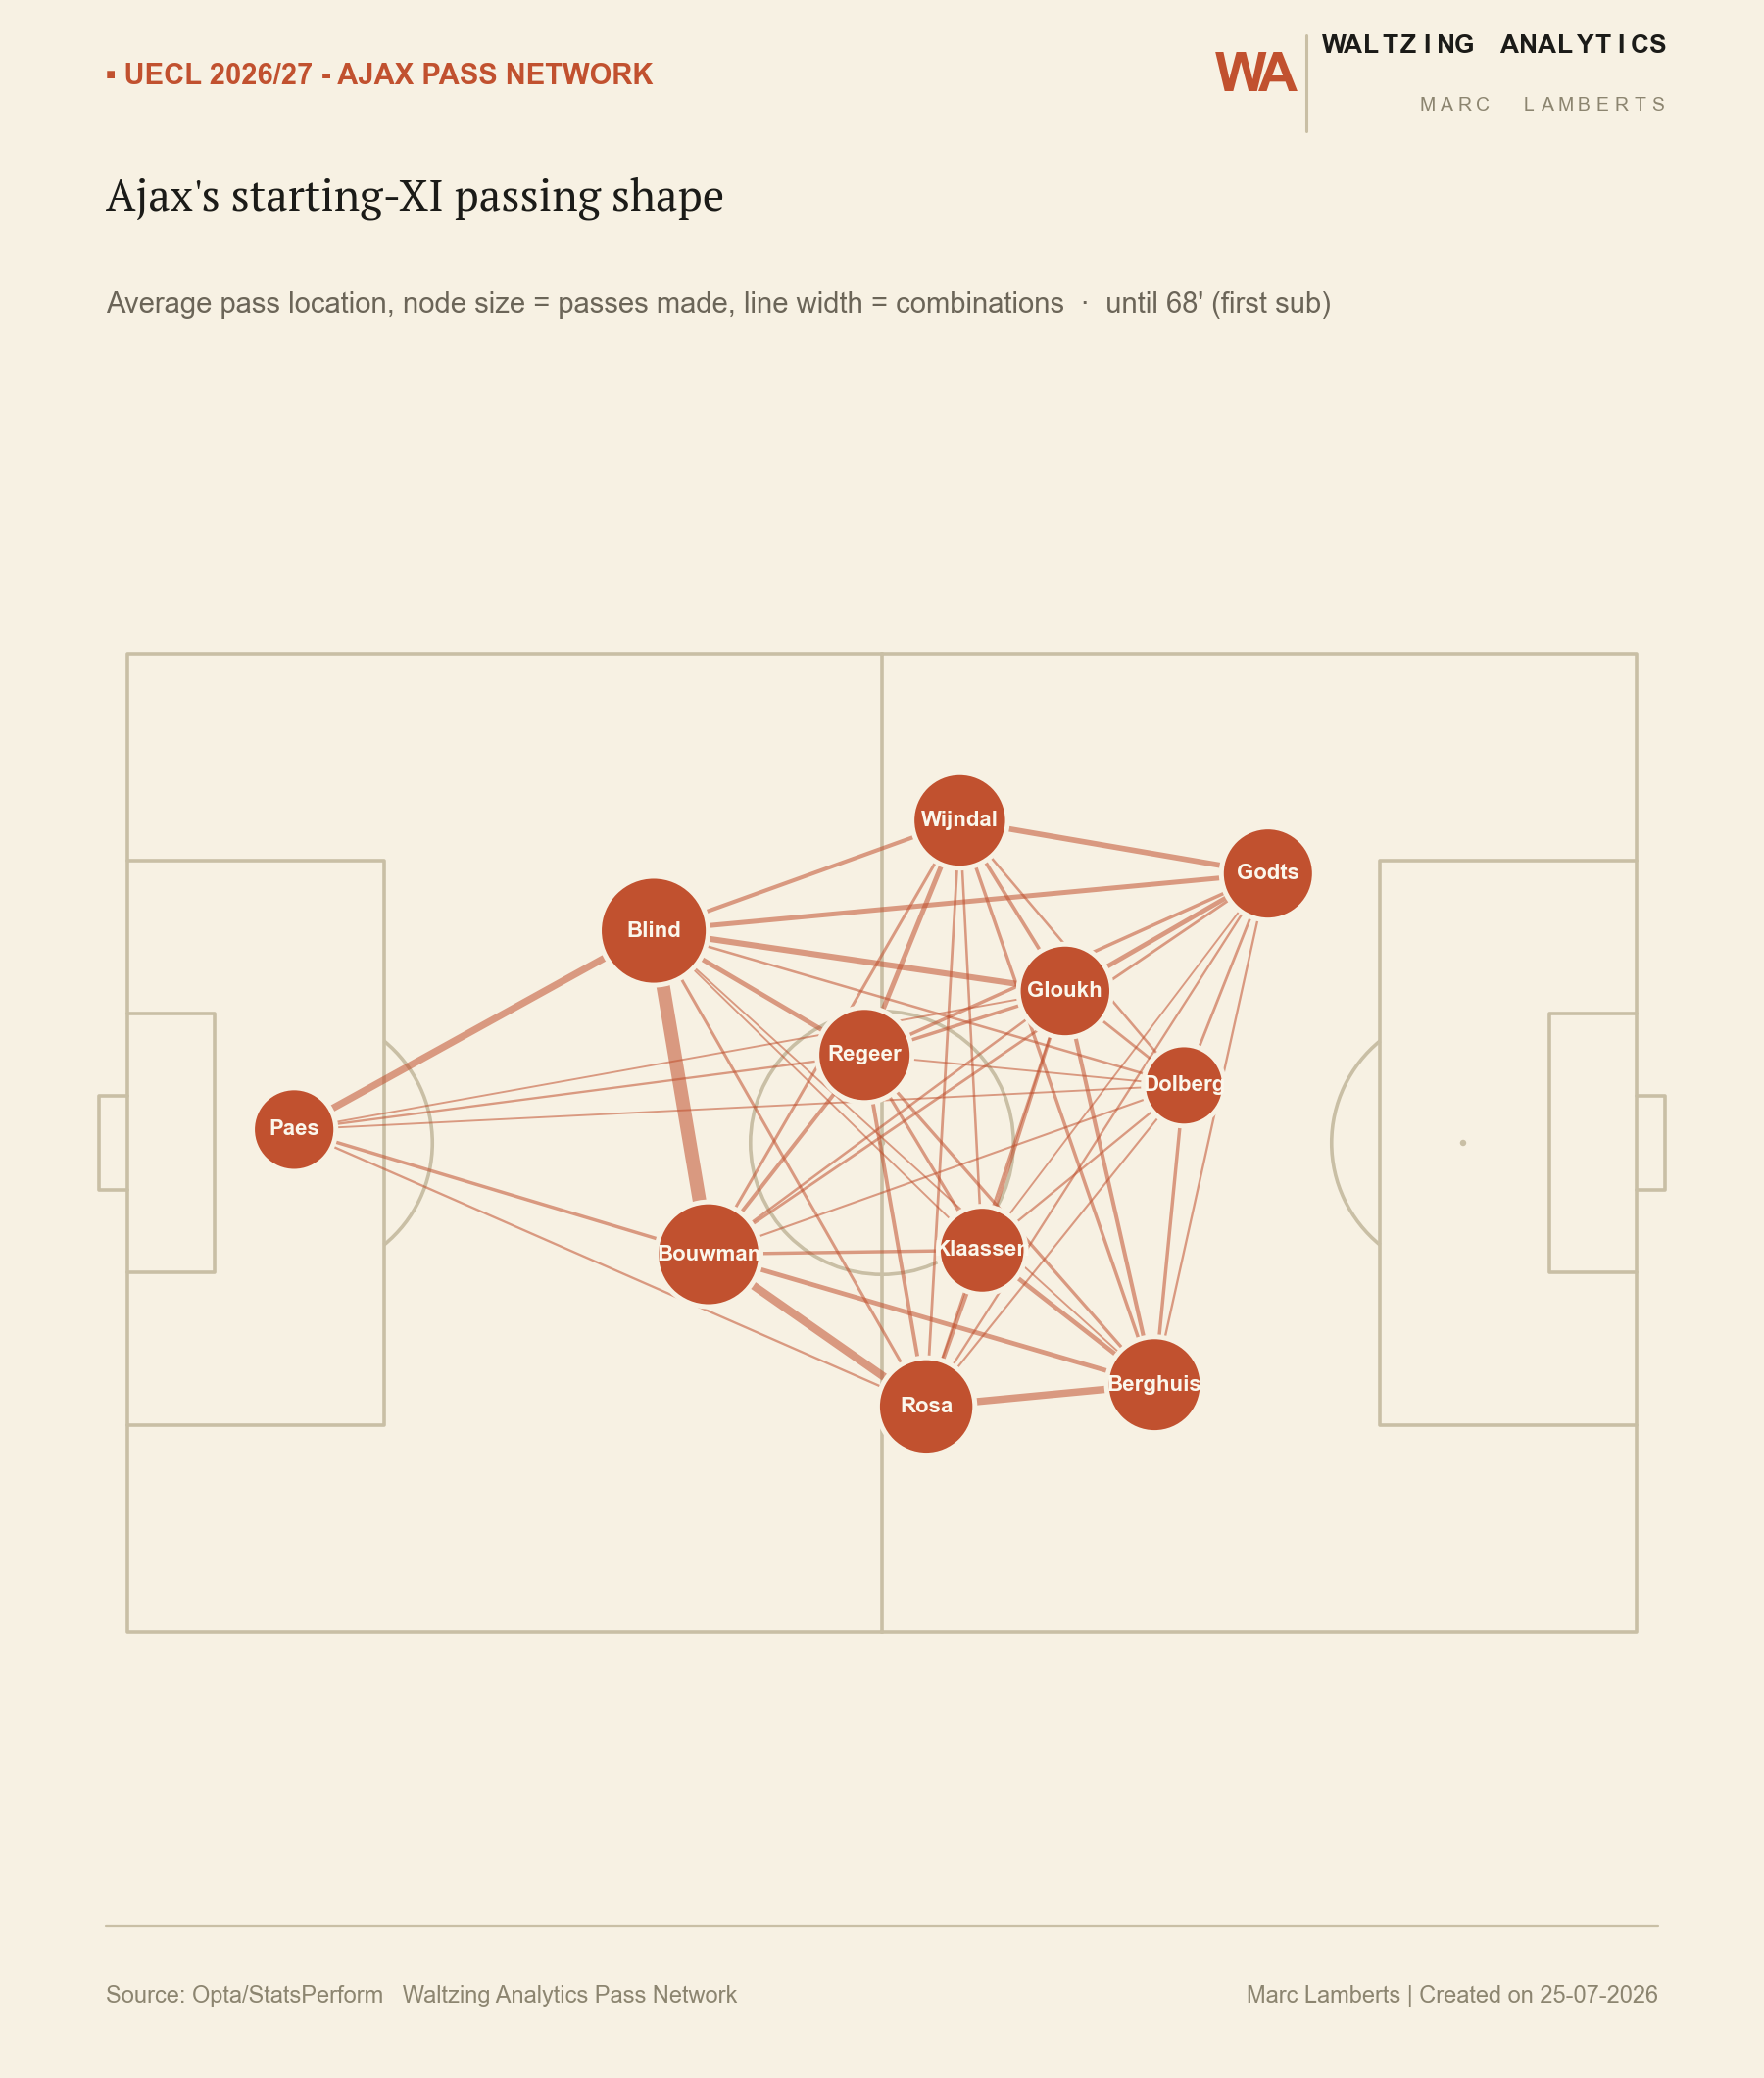
Ajax starting XI pass network, node size showing passes made and line width showing combination frequency
Ajax's starting-XI passing shape — average pass location, node size = passes made, line width = combinations, until the first substitution.

As a service

Commissioned, this becomes a standing report: a post-match breakdown turned around within a day or two of full-time, or a season-long tracking dashboard that updates itself as new matches come in. Scope is set upfront: which patterns matter for your team, which opponent tendencies to watch, so the report answers a real question instead of listing every chart the data could produce. Get in touch to set one up for your next match or season.

← Back to Services