
Recently, I have been having conversations with some data sceptics. Some are more respectful than others, but there’s something about it all that surprises me. The sceptics view “us” data-heavy enjoyers of the game as a whole different category. As if we were to view data as the sole way of looking at the game and never watch a game. This, of course, works the other way around as well for them. I couldn’t disagree more, because I think data and video are complementary to each other when trying to analyse games, teams and players.
In this article, I want to illustrate that and go beyond my usual scope of just writing about the methodology and data visualisation. I want to show, with real clips/stills, how the data we just created can be used in a way that also serves the needs of the video analysts and scouts. I’ve made a new model and subsequent metric: Expected Fails Forced.
Contents
- Introducing Expected Fails Forced (xFF)
- Data representation
- Theoretical framework
- Methodology and calculation
- Model validation
- Results
- Data visualisations
- Netlify app
- Challenges
- Final thoughts
Introducing Expected Fails Forced (xFF)
Okay, okay, okay. 3,5 years ago I wrote a critique of the metric PPDA and how it is used (and made some people at StatsBomb quite angry). The critique focused mostly on how that one metric like that (a ratio-metric) can’t fully grasp the pressing intensity of a team. My view was (and still is) that the metric is much too oversimplified and should always be viewed in the context of several other variables.
I definitely made some people quite angry, but also feel like this is what needed to become better at our jobs, and always strive for better data models in our space of sports analytics. Looking back at it, I know I haven’t been very fair by only offering critique and no alternative. So, let’s rectify this today.
Previously, I designed a model and metrics that calculate the expected disruption of a player. And I think it still is a cool concept:
Expected Disruption: Modelling Defensive Interventions in Football
This study introduces a machine learning framework, named Expected Disruption, to predict defensive interventions in…
There is one big thing that I do think needs improvement: defensive activities are quite rigid. A tackle, an interception, a challenge; those are very rigid on-ball behaviour. The next step for me is to measure off-ball behaviour away from tracking data, and that’s what we can do with pressing metrics.
Pressure is one of football’s most visible defensive actions, yet its impact is difficult to capture in data. We can see when a defender closes down an opponent, limits their options or forces them into an uncomfortable action. In the event data, however, the outcome is usually attributed only to the player in possession. When a hurried pass goes astray, the defender who caused that mistake often receives no credit.
That is the idea behind Expected Fails Forced, or xFF: a metric designed to estimate how much a defender’s pressure contributes to opposition pass failures.
Rather than simply counting unsuccessful passes made under pressure, xFF considers the circumstances surrounding each action. This matters because not every failed pass is caused by pressure, and effective pressure does not always result in an immediate turnover. A defender can disrupt the passer’s execution or decision-making even when the ball still reaches a teammate.
Data representation
The data I’m using for this article and from my model comes from IMPECT. In the next articles, I will focus more and more on IMPECT data. The data I’m using is both raw event data and aggregated data. These datasets were collected on August 24th, 2026 and were saved as JSON files through the IMPECT API.
IMPECT by Catapult | Football Intelligence and Scouting Data Across 160+ Competitions
Most clubs measure what happened. IMPECT shows why it happened and which players made it happen. Football analysis and…
My idea is to have high-quality analysis but focused on lower-tier football. For the results in both data and visualisation, I’m looking at the German 4th tier Regionalliga West, as well as Ligue 3 in France and the Serie C in Italy.
However, to train the data, I’m looking at more leagues and seasons. To properly use this model, I want over 1 million useful events of passing and pressing, which leads me to the following:
- Eredivisie 2024–2025 and 2025–2026
- Eerste Divisie 2024–2025 and 2025–2026
- 3. Liga 2024–2025 and 2025–2026
- Serie C 2024–2025 (3) and 2025–2026 (3)
When looking at this training data, I have surpassed 1 million passing events. In fact, I have 3,76 million passes over these 12 leagues. Serie C consists of 3 different regional leagues, hence the level of coverage.
Theoretical Framework
There are a few mathematical and statistical theories that are the basis of our calculations:
The first theory we employ in our research is the statistical learning theory. It focuses on estimation. For the first version of the model, I look at logistic regression for a two-outcome variable. For the second version of the model, I look at Gradient Boosting. This calculates the estimate of P(success) or P(failure).
The second theory we are using is something called counterfactual reasoning. This takes our classifier towards a true Expected Fails Forced under two different states. We look at pressed passes and passes that aren’t pressed. This is the core of the metrics, but not so much the underlying model.
The last theory we use is the calibration and validation theory. This will answer the question: can this model be trusted? This consists of proper scoring rules (Brier, log loss), signal detection theory (ROC/AUC), information theory (entropy, surprise), residual diagnostics (Pearson z-scores), and resampling theory (cross-validation).
Methodology and calculations
So I have two versions of the model, with V2 being the best. But to start with V1, I will have a look at how it’s been built. The first version is built on the Bernoulli distribution, which focuses on the fact that there is a binary choice: success or failure.
While I did like that idea, it was built with logistic regression. I did like the idea at first, but I found a flaw in my way of thinking. The features I am using (and added) are not linear. Furthermore, the accuracy of prediction actions is higher with Gradient Boosting, which I have used for V2.
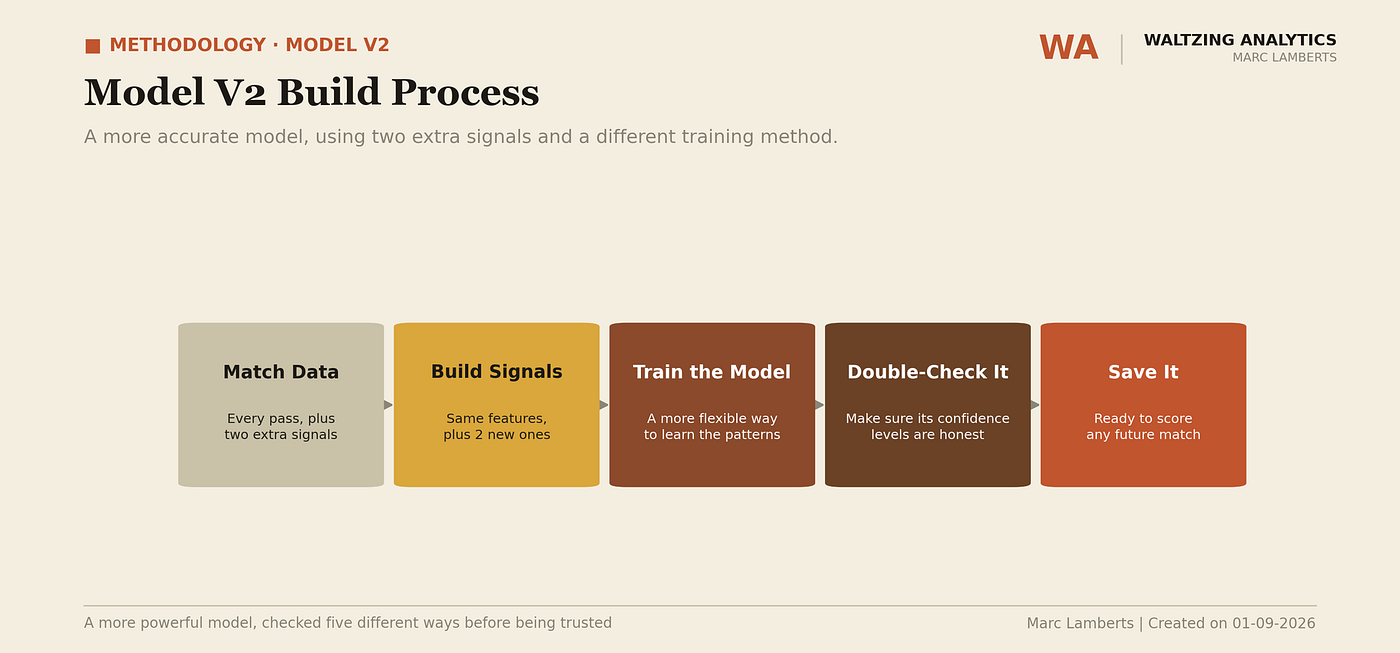
As you can see in the flow above, this explains how the V2 process has been done. First, we look at the match data in our JSON files before we flag signals. These are all the features that are considered important in our model. You can see in the graph below how the features’ importance was:
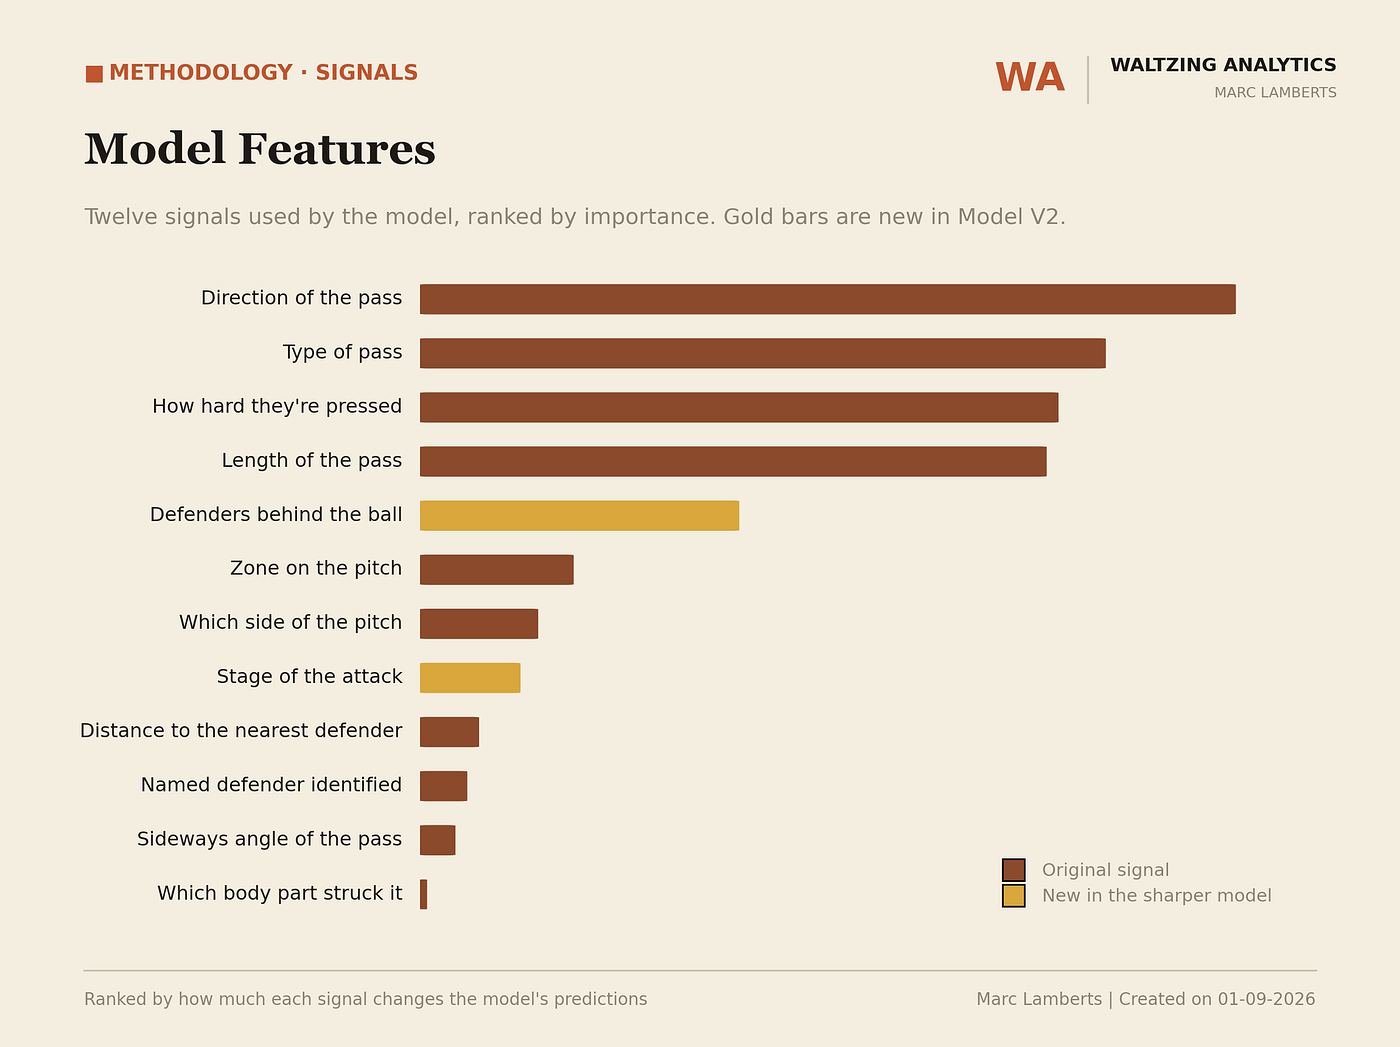
We are looking at the features that go into the model here, and we see that direction of the pass, type of pass, and the intensity of the press are most important.
Another thing that’s important is that the defenders behind the ball and the stage of attack are added in V2, making the model more complete. This also shows the importance of gradient boosting instead of logistic regression, because of the non-linear relationship of the features.
Model validation
Another difference between the models is that V2 has a different training/test split. In V1, there was a 75/25 split on the data. This means that 75% was used to train the model and 25% was used to test the model. In V2, this is different. V2 looks at an 80/20 split, but trains it on five different occasions and then looks not at a single number, but at an average of those five times.
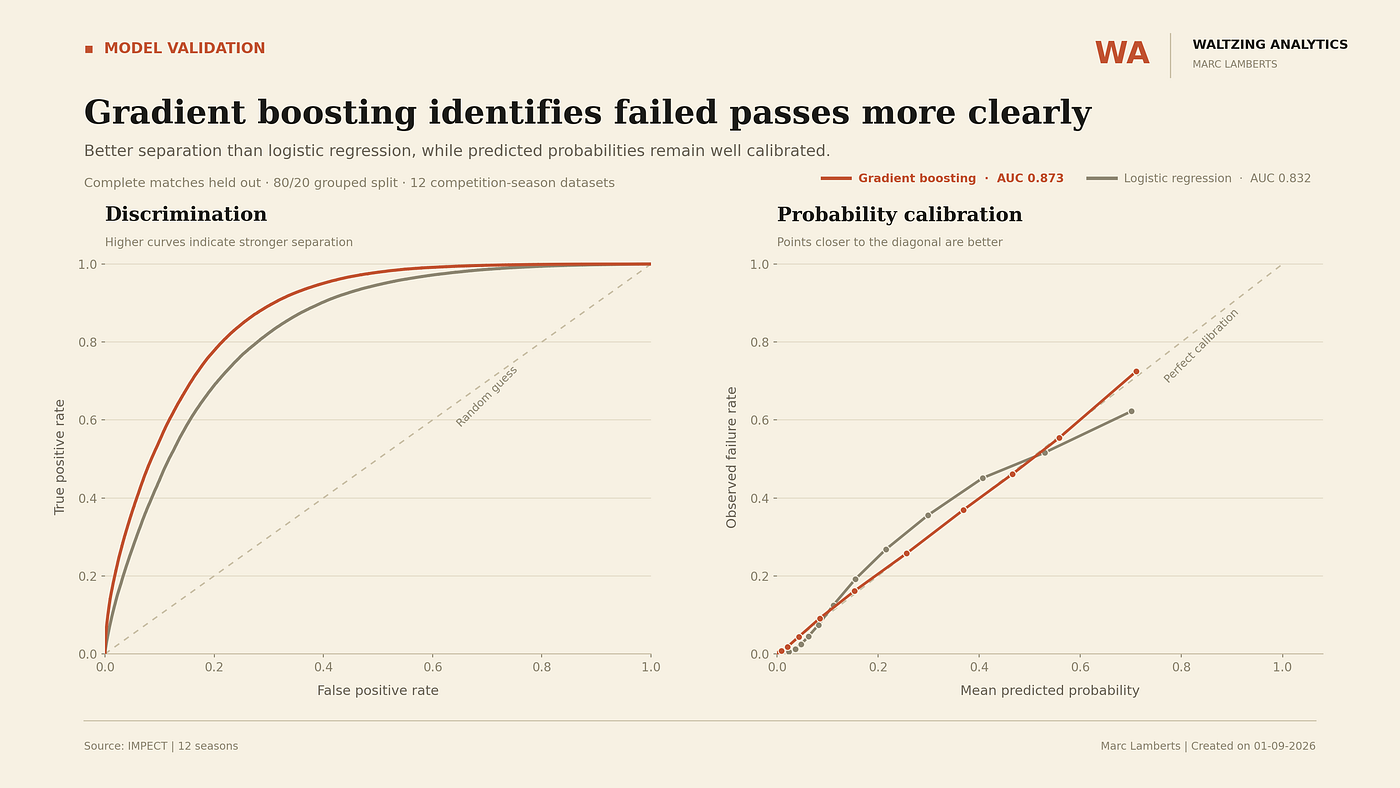
In the image above, you can see how it works. On the left chart, you can see the ROC, which shows how well the model can separate the true positive rate from the false positive rate. How well can it recognise a correct metric? This is measured in the AUC value. A score of 0.5 is random, while a score of 1.0 is perfect.
Our model in the V1 version has a score of 0.832, while V2 has 0.873, which means that version is better at predicting whether there is a forced fail. This is also reflected in the second graph of calibration, where V2 stays closer to the perfect calibration.
Results
We have trained the model V2 on 12 leagues and saved it to a PKL file. In Python, we run this model for our league that we want to look at more closely. For me, that’s the Regionalliga West 2025–2026. So let’s have a look:
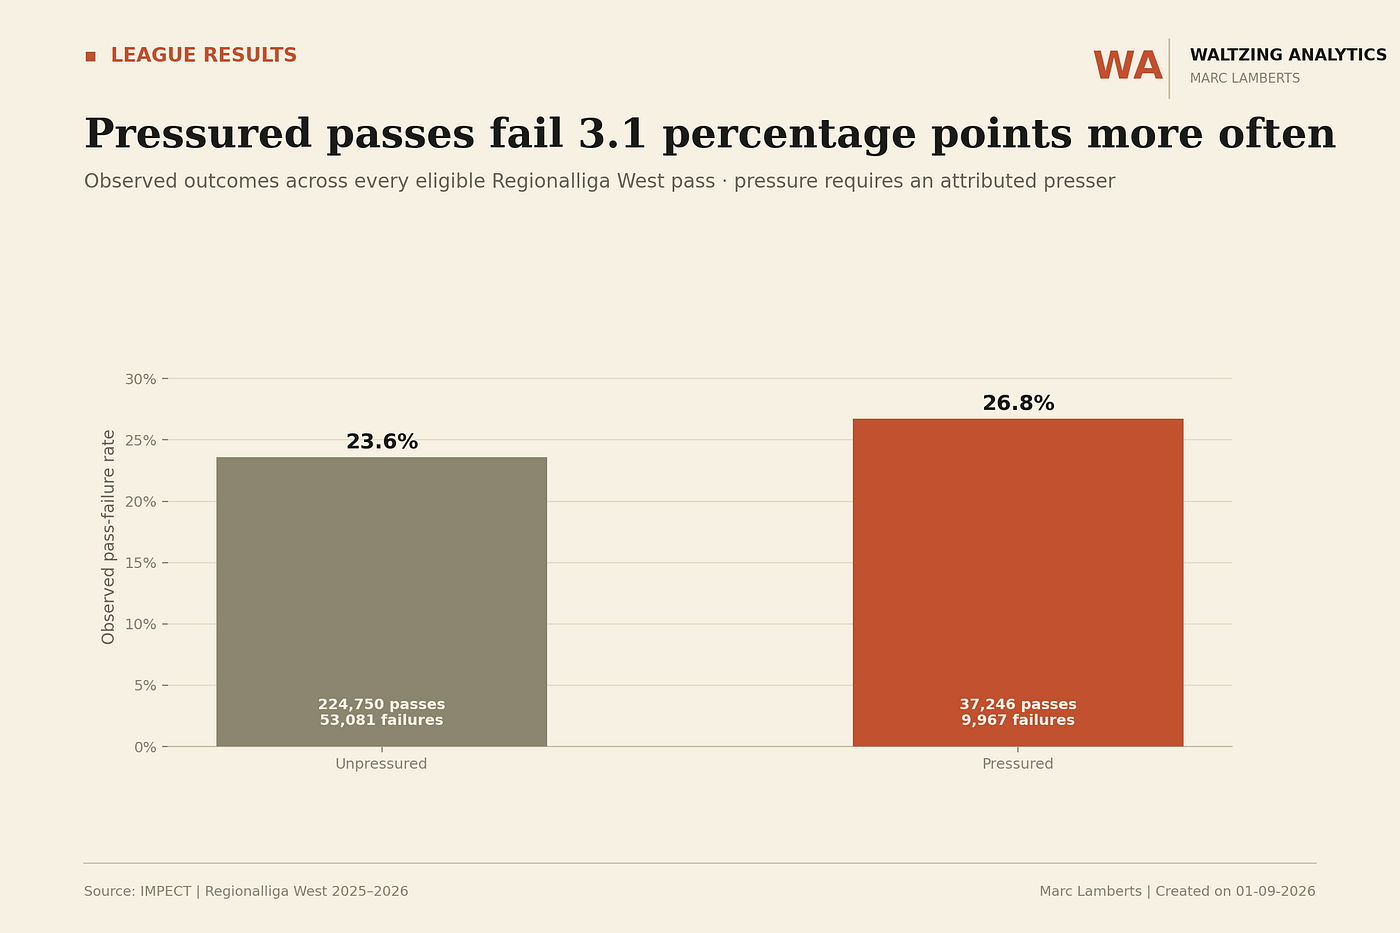
In the above graph, you can see the differences between pressured and unpressured passes. While there are 224,750 unpressured passes and 52,081 failures with 23,6%, that’s lower than the 26,8% of failures with pressured passes (37,246 passes and 9,967 failures).
The share of unpressured passes is 85,8%, and the share of pressured passes is 14,2%. Now let’s have a look at the xFF per situation:
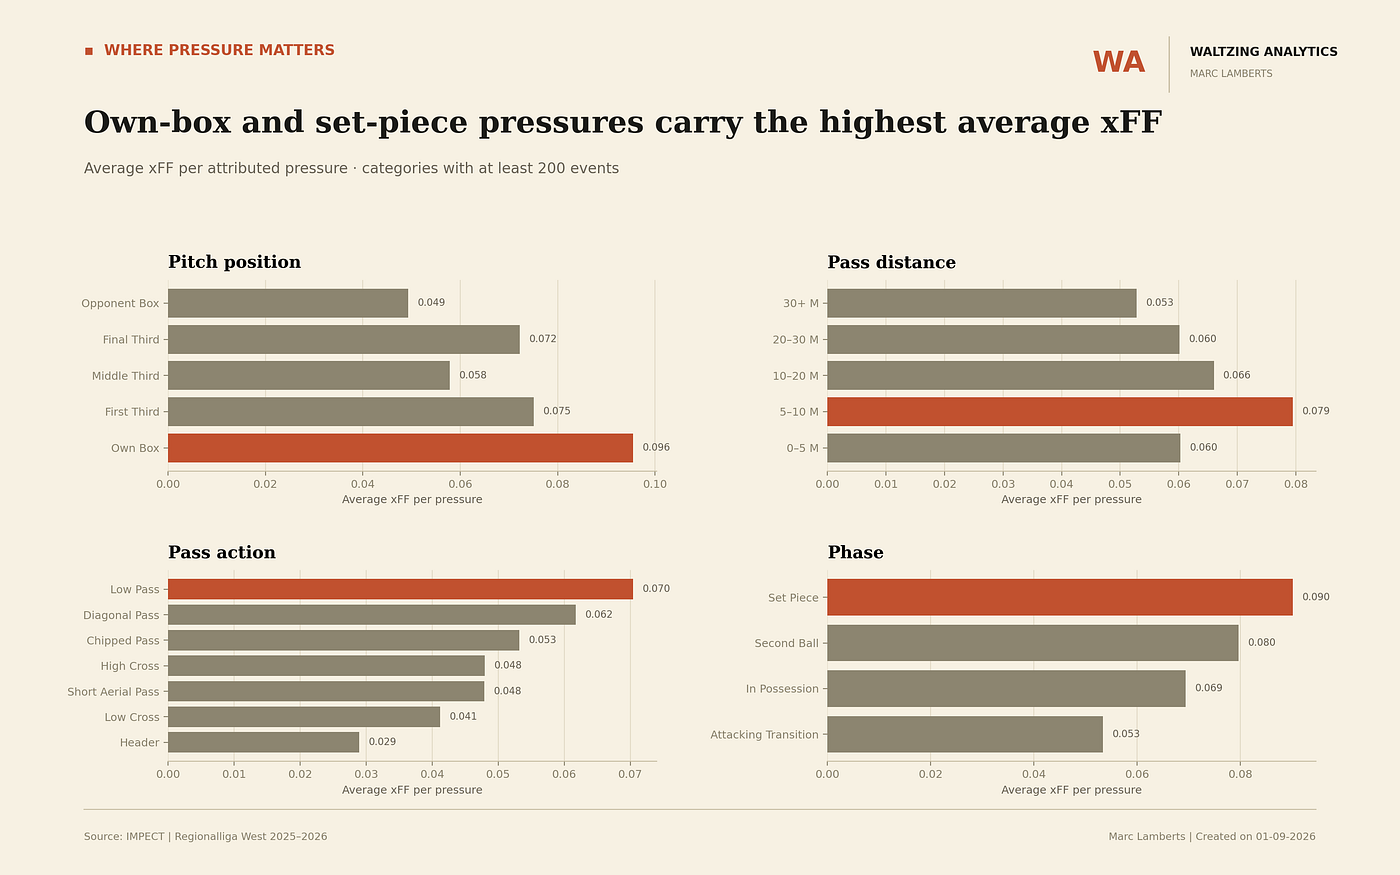
In the graphs above, you can see the different situations and where the Expected Forced Failures is the biggest.
For the pitch positions, it’s the own box from the passer’s perspective. For the pass distance, it’s the passes that are played with a length between 5 and 10 metres. For the pass actions, we can see that the low passes have the highest xFF per pressure, and finally, the phase in which xFF is highest per pressure is Set Piece. If you look at open play, we can see that it’s the second ball phase.
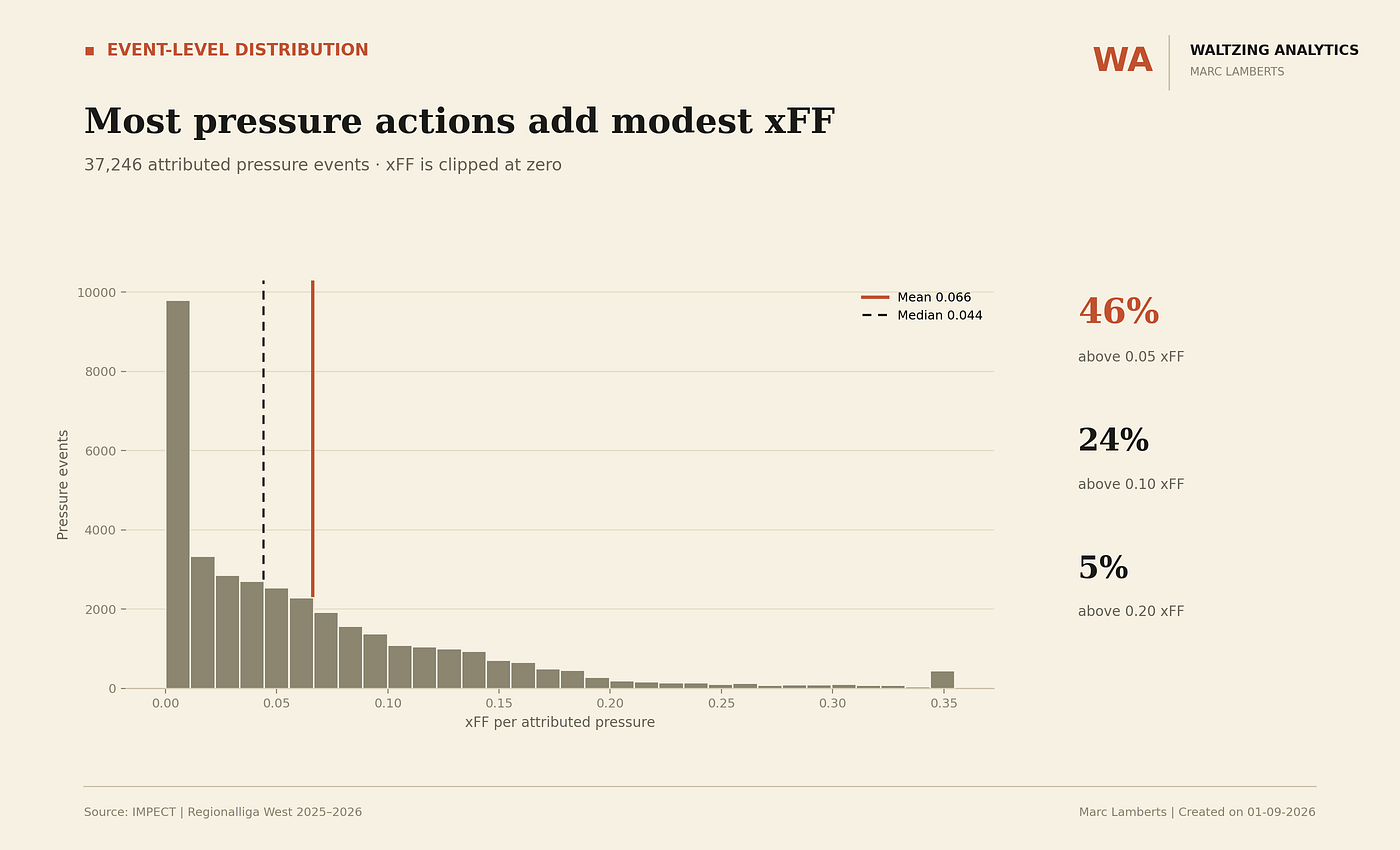
When we look at the distribution, like here above, we see that most pressure actions are low in xFF. 46% of the pressures have xFF of 0.05, 24% above 0.10 and only 5% above 0,20 xFF. The mean (average based on all observations) for xFF per pressure is 0.066, and the median (the middle value) is 0.044.
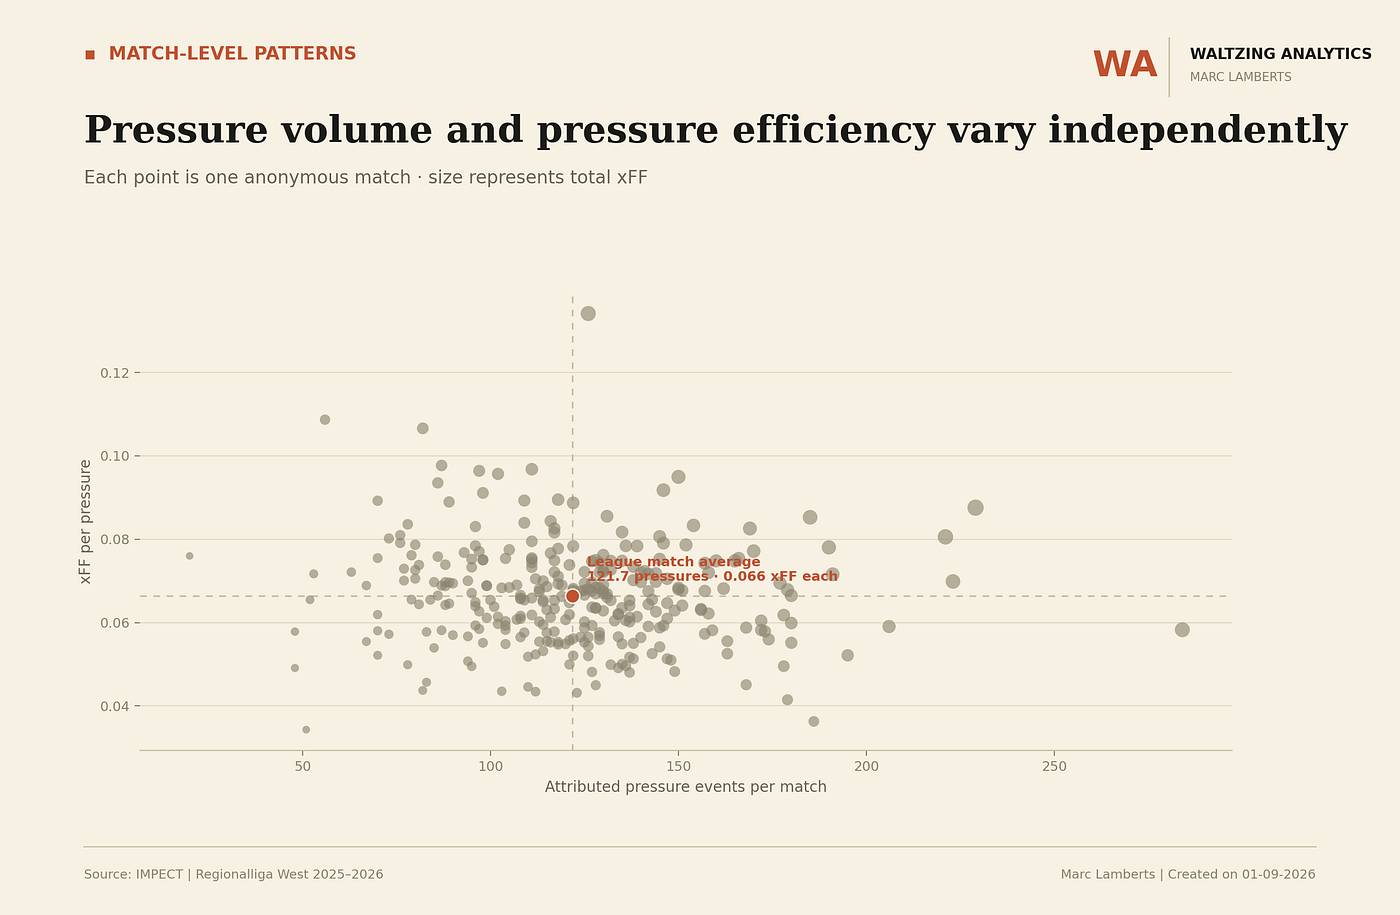
In the scatterplot above, you can see the pressure volume in this league in 2025–2026 compared to the xFF value per pressure. What you can see is that the league match average is 121.7 pressures, and the average is 0.066 xFF per pressure, which we already deducted from another graph above.
Finally, let’s look at a pitch! Where does the most danger lie for a passing/in possession team?
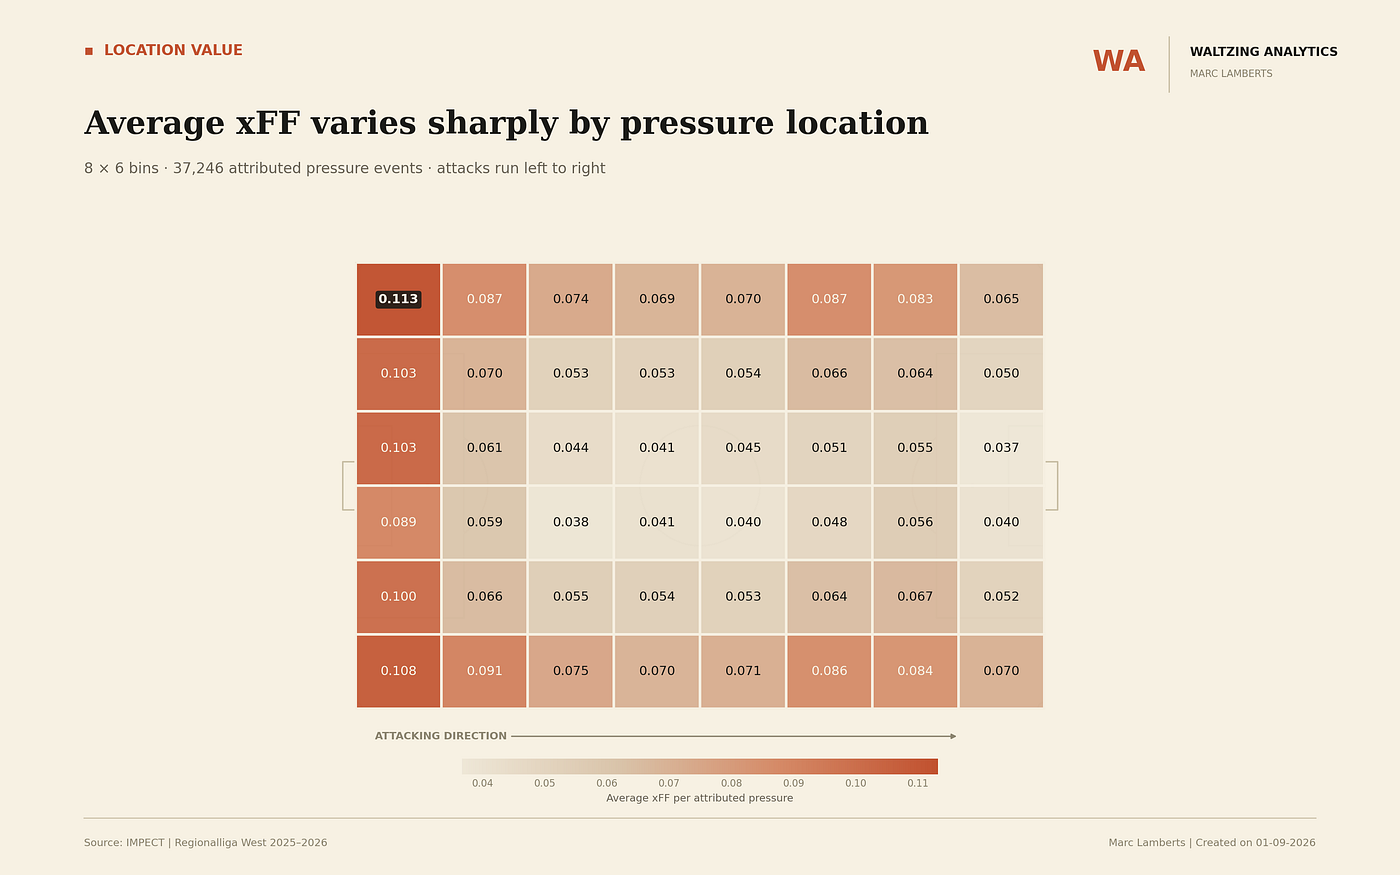
If we look at this pitch bin map, we can see where the values of xFF are the highest and the lowest. This is vital for both attacking sides (those who pass) and for defensive sides (those who press).
By looking at these values, we can state where the risk of a failed pass under pressure is the highest. We shouldn’t, however, come to the conclusion that this is the same as ball loss or ball regain, because we do not know if possession changes after a forced failure.
Data visualisations
Now we are going to the part that looks pretty on social media. Which teams are performing the best in Expected Fails Forced?
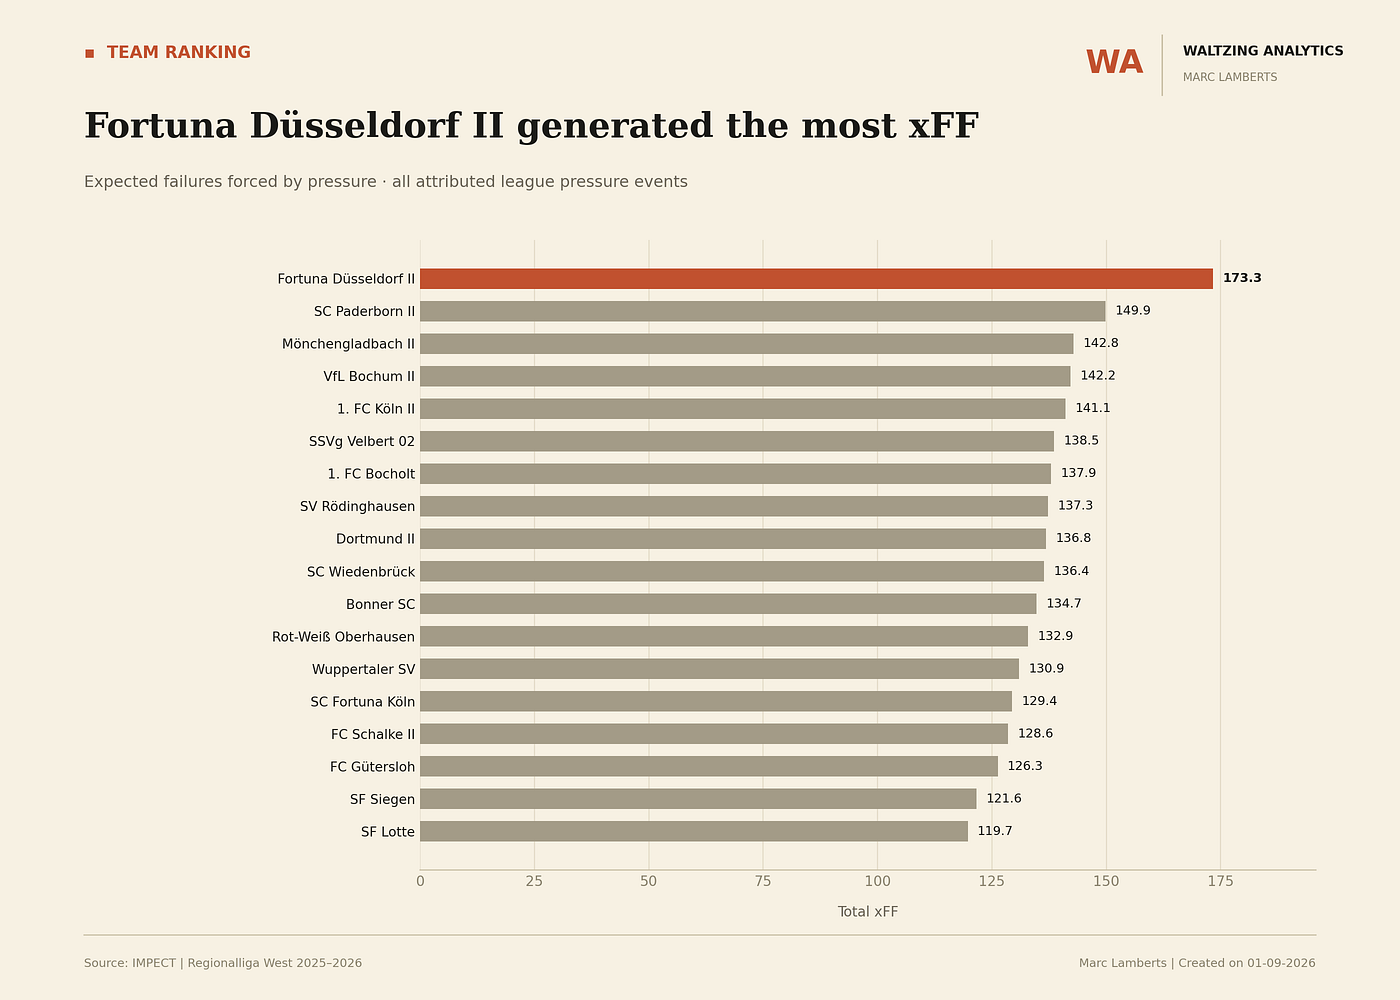
In the bar graph above, you can see that Fortuna Dusseldorf II created the most xFF and are much better than the rest. Paderborn II follows, and then Borussia Monchengladbach II.
Gütersloh, Siegen and Lotte perform the worst in this specific metric. They have the least xFF of the whole league in 2025–2026.
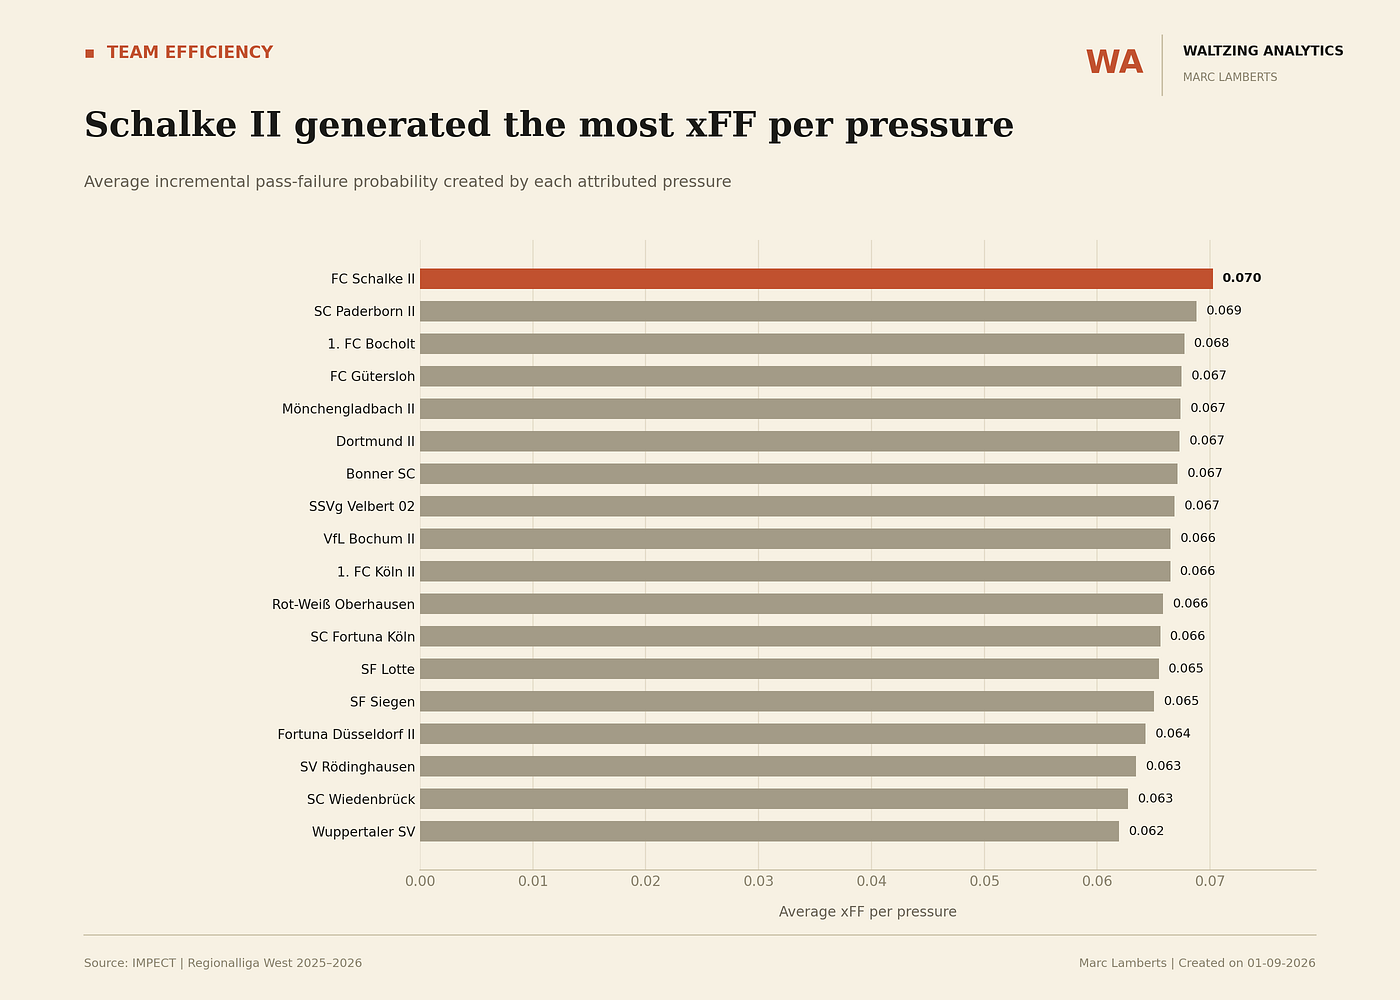
We previously looked at the total xFF, but which team has the highest xFF per pressure? That is Schalke II, followed by Paderborn II and FC Bocholt. Rodinghausen, Wiedenbruck and Wuppertaler score the lowest.
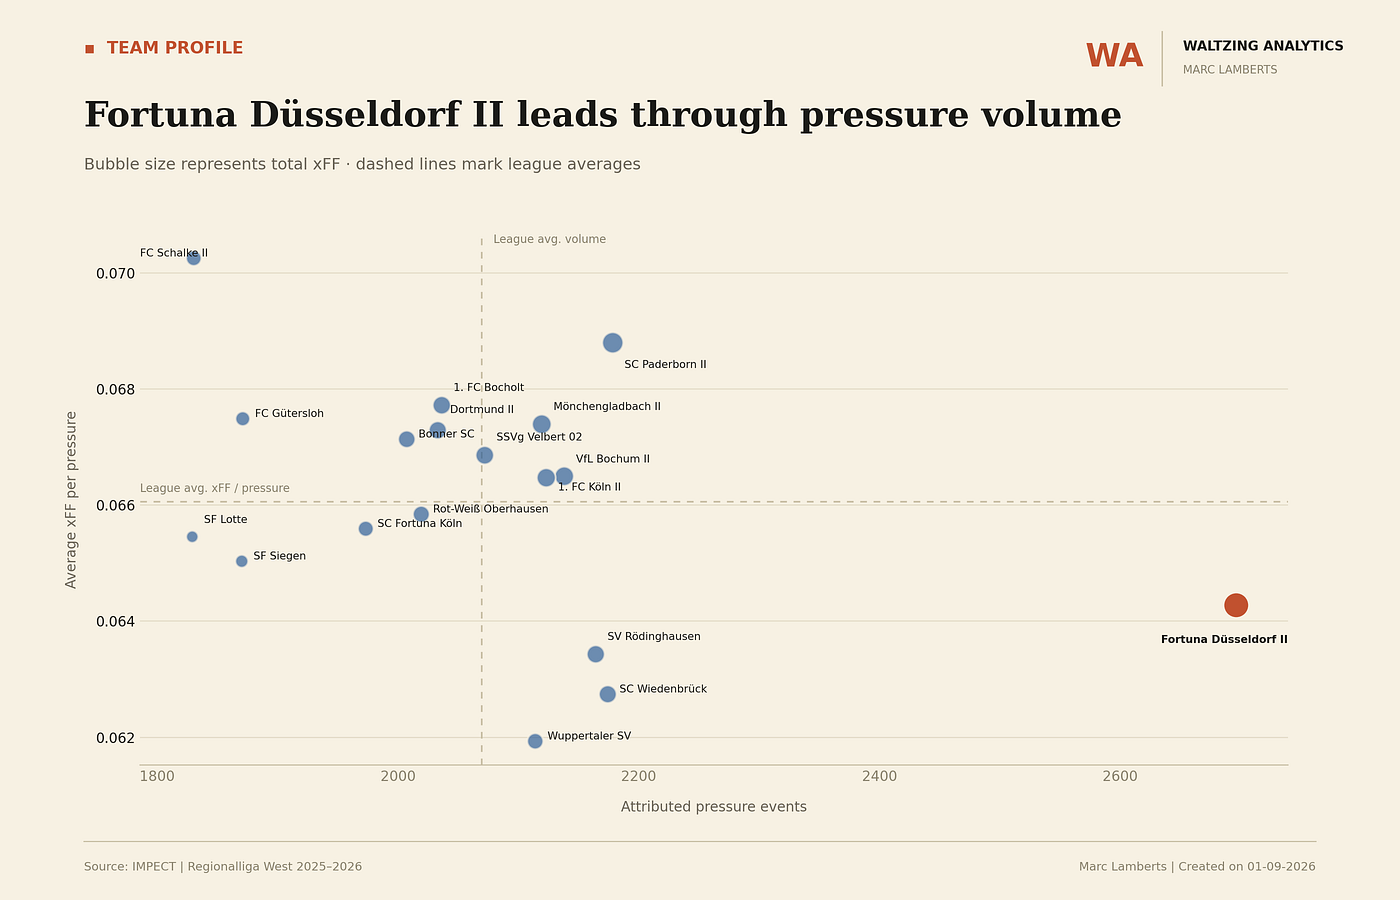
Let’s see it in a scatterplot. The pressure events in volume compared to the average xFF per pressure. Fortuna Dusseldorf II has the most pressures by far, but the average xFF per pressure is quite low.
Schalke II, in return, has one of the fewest pressure events in total, but clearly the highest xFF per pressure. We can conclude that the intensity of the press of Schalke II also led to more xFF in the 2025–2026 Regionalliga.
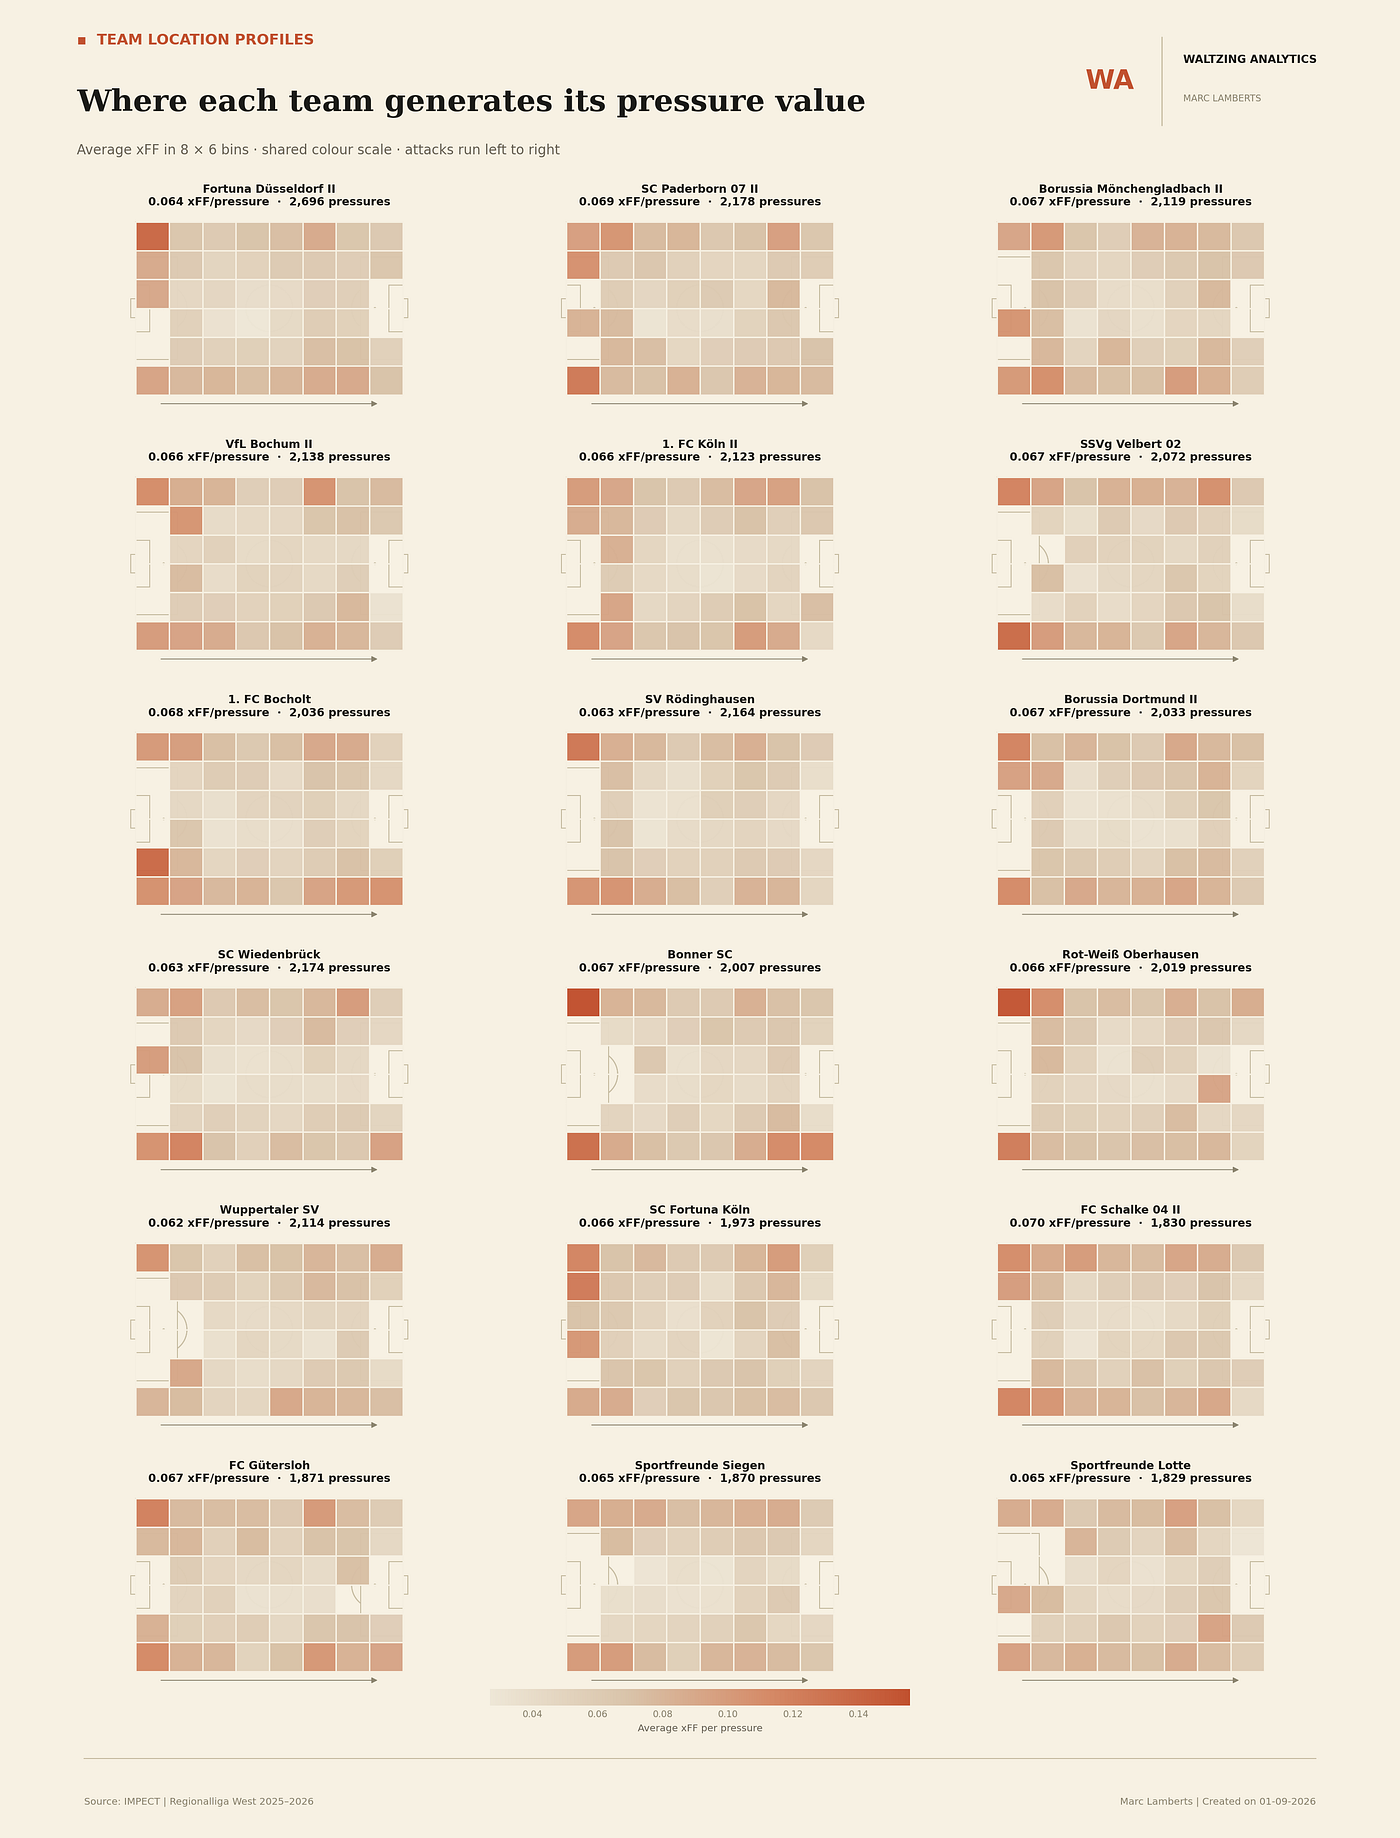
In the image above, you can see where each team presses the most according to their value of xFF.
Netlify App
I’ve created a web app on Netlify where you can see more interactive tables, graphs and filters, so that you might understand a bit more about this model, metric and the results. You can find it here:
Expected Fails Forced | Waltzing Analytics
Interactive analysis of pressure value in the Regionalliga West 2025-2026.
expectedfailsforced.netlify.app
Challenges
There are three distinct challenges to my model. Nothing is ever perfect, and without true tracking data, we can’t fully observe its totality:
Finally, comparisons require sufficient context and sample size. Total xFF is affected by pressure volume, possession share, playing time and opponent behaviour, while xFF per pressure measures effectiveness rather than pressing intensity. Player, match, and pitch-zone averages can also be distorted by small sample sizes. Model performance may vary between competitions and seasons, making continued external validation and recalibration necessary.
The first challenge is causal attribution. xFF estimates how much pressure changes the probability of a failed pass, but it cannot prove that the defender caused the failure. The counterfactual is modelled rather than observed. Passes can also fail due to poor execution, difficult angles, or limited options. Furthermore, a coordinated press may involve several defenders, while the data attributes the action to only one pressing player.
Event data cannot capture every aspect of pressure. Approach speed, body orientation, cover shadows and passing options removed by teammates are difficult to represent without tracking data. The model also evaluates only passes, even though pressure can force dribbles, clearances, backward actions or delayed decisions. A failed pass is not necessarily a possession regain either, so xFF should not be interpreted as expected turnovers or expected possession won.