Basically, I’m really bad at writing intros, but trust me — this is a fascinating article to read. My aim for this article is to delve into American Football, more specifically, the NFL and/or NCAA college football. The reason why? Firstly, I think it can be fascinating to really delve into other team sports all across the globe, because I think we can learn from certain patterns and methodologies and apply them to football. And, perhaps in time, I might actually try to do it vice versa.
The second reason, and perhaps also my biggest motivator, is to look at whether we can gain value from possession based on plays in the NFL. We have been seeing a rise in the reliance on set pieces with accusations that we are looking more and more to NFL plays in football, instead of open play creation. I personally don’t think we are heading that way, but it’s worth exploring nonetheless.
This research aims to convert “plays” to similar possession and add value to these possession sequences with relation to the final third. In essence, I want to add value to possession sequences that end in the final third and start with a certain type of play. In the process of doing so, I’m looking for possession sequences that are neither set pieces nor open play, but a modern hybrid possession style.
This article is part of my bigger project Lessons from which aims to look at analytics and data visualisation from other sports and see whether we can apply it to football. In addition to that, not every form of analytics is good or bad for football, but the real education and improvement for myself is in the actual process. Trust the process and all that.
Contents
- The data
- NFL data
- Converting plays to football
- Methodology
- Mathematics
- Value model
- Team Analysis
- Player Analysis
- Challenges: should we use this?
- Final thoughts
From time to time I like to look at other sports in the world and see what we — football enthusiasts — can learn from other disciplines in elite sport. By doing that we can learn about innovative ideas that we can transition into football, but also to recognise that some models related to data, are already working very well.
Data
For this research, I had two different sets of data. The first set of data is NFL data. I can’t just start with the research without having an understanding of what the NFL data is and how it adds value to the game.
For the NFL data, I look at an R Package about NFL data. I’ve used R to understand and get the data, and also being able to clean it. You can read and install this package by going to this link. I accessed the data on Saturday, 18 October 2025. The thing I’m most interested in is the play-by-play data for the players and teams in the NFL. What I want to get from that data is based on plays, rushes and passing — which. I will touch upon it later.
For the football data, I’m looking at raw event data from the Portuguese Primeira Liga from the 2025–2026 season. The data is from Opta and contains all on-ball from the season for the players and teams. I have looked at all matches before 17 October, because at the moment of writing, this round of matches is being played. I’ve accessed the data from the API and collected it with Python.
I’ve mentioned both R and Python; these are the programming languages I use most frequently for all my analyses. I don’t necessarily think one is better than the other, nor do I think you should stick to one or both, but I find that a combination works pretty well.
NFL data
I had a look at the data and I need to stress one thing before we get into this: this can be so overwhelming! Delving into data of a sport you are not as knowledgeable in as football, but have the same level of depth in terms of analytics.

I saw the concept of rushing yards and passing yards, which was very interesting to me. Rushing yards are the total number of yards a player makes while on the ground with the ball. Passing yards are the total number of yards the ball travels when a player makes a pass.
Why is this interesting to me? Because we can use these concepts and use them in football, looking at carries (rushing) and passes (passing). But before we do that, we need to look at another specific thing in American football.
I want to look at the explosive label for both metrics. A play is considered explosive when a rushing exceeds 10 yards and when a passing exceeds 20 yards. They are then named explosive because they have generated a certain progression on the field.
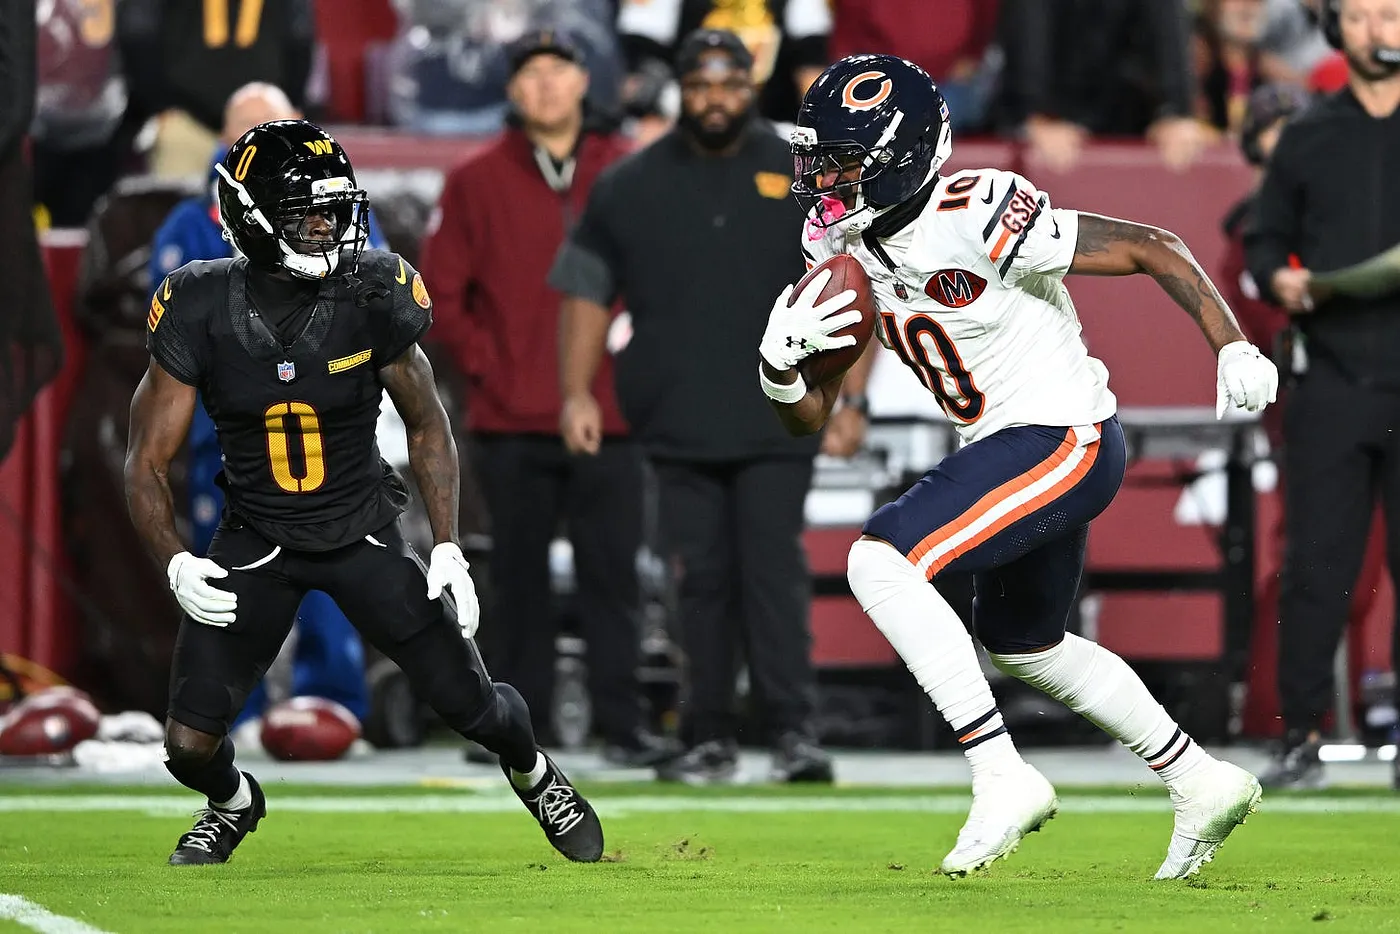
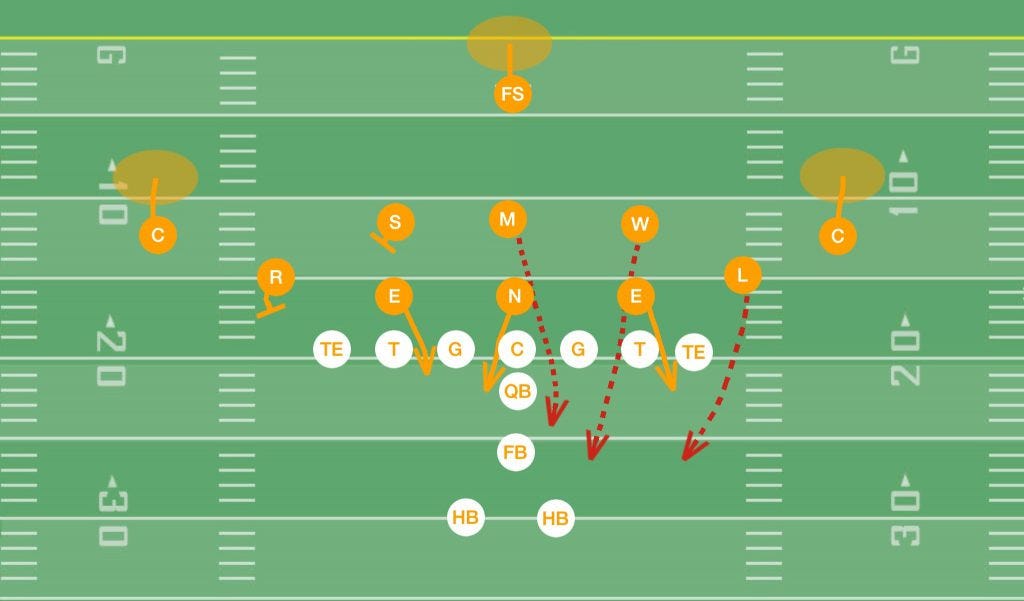
Plays in American football
Okay, what are plays? In the NFL, a play is a single action or strategic sequence of events designed to advance the ball toward the opponent’s goal line. It begins with a snap or a free kick and involves specific roles and movements for each player on the field for a short duration, until the ball is dead or out of bounds. Examples include passes, runs, and kicks like punts, field goals, or kickoffs.
So, when I first started looking at plays, it just didn’t make sense to me. How should I perceive plays? Is this what American Football is? A series of plays? What really helped me is just watching a ton of plays on YouTube. I’m definitely not an expert, but seeing it pan out on the field helped me a lot.
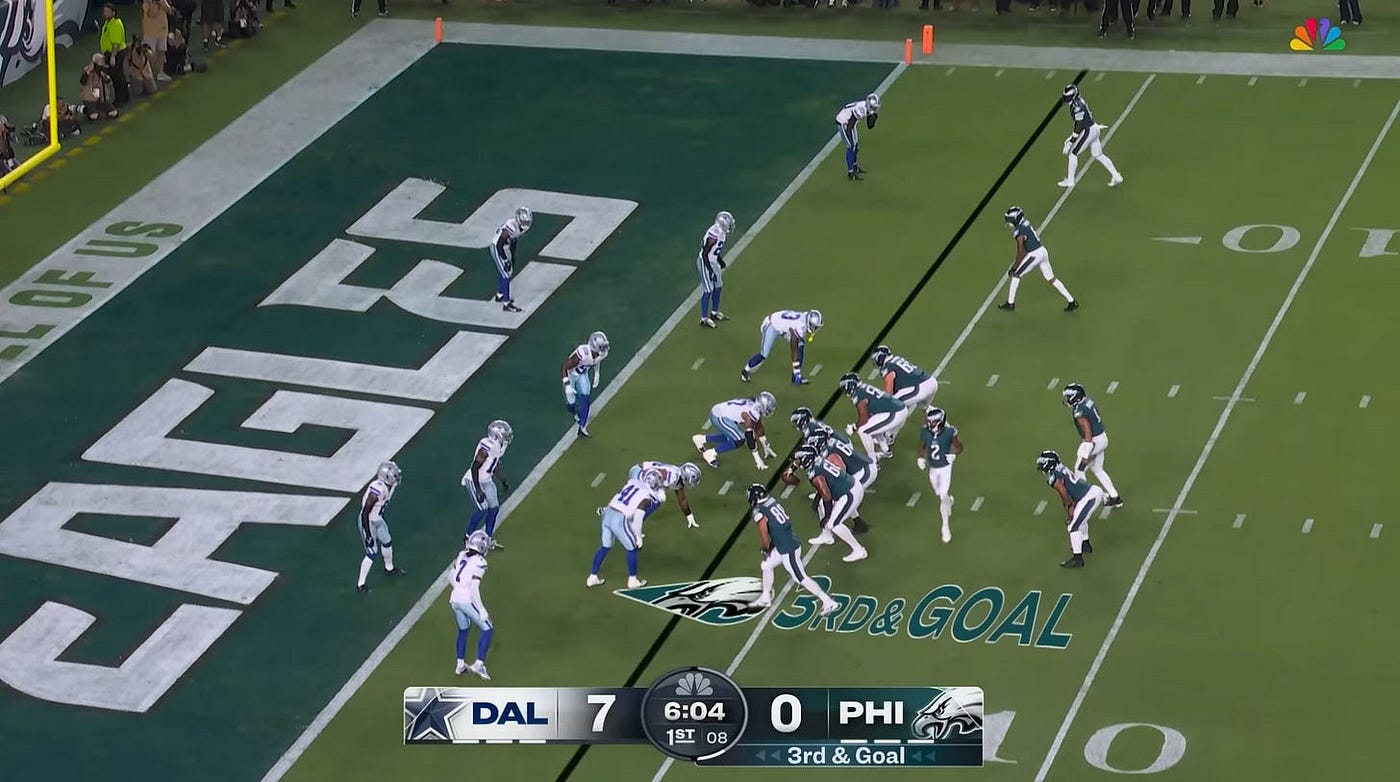
[Click on the image for the link to the YouTube video; the NFL doesn’t allow their content outside YouTube]
The biggest question in this research wasn’t how I would translate passing and rushing to football, because we have passes and carries for that in a certain sense. Explosive plays are easy to calculate as well. The biggest question for me is how I would define plays in football.
My initial thought was that I would go with set pieces. Football is much more fluid and up and down than the American Football we see in the NFL. However, when we look at the plays in the NFL, we see that’s very much a set piece kind of vibe, but it’s almost about advancement, because there is no direct scoring option. What that means is that a set piece in football can be designed to score directly (penalties, free kicks, corners) or with first contact. We should look at something that sits between a traditional football set piece and open play. We should look at strategic areas of the game where we have to progress up the field, but didn’t start as open play.
Methodology
So, as described above, if we are going to use some concepts from the NFL, we need to convert them. As said before, the carries and passes can be straightforward in calculation, but for the plays, we need to find a different way.
Plays in my research, and this can be different for different people, will be going down in football as possessions that happen after a restart. I’m doing this to avoid pure open play possession, but also to look beyond regular set pieces. By doing so, I want to design plays in football as possession that qualify for the following start:
- Goalkicks
- Deep free kicks
- Kick off
- Defensive throw-ins
Goalkicks
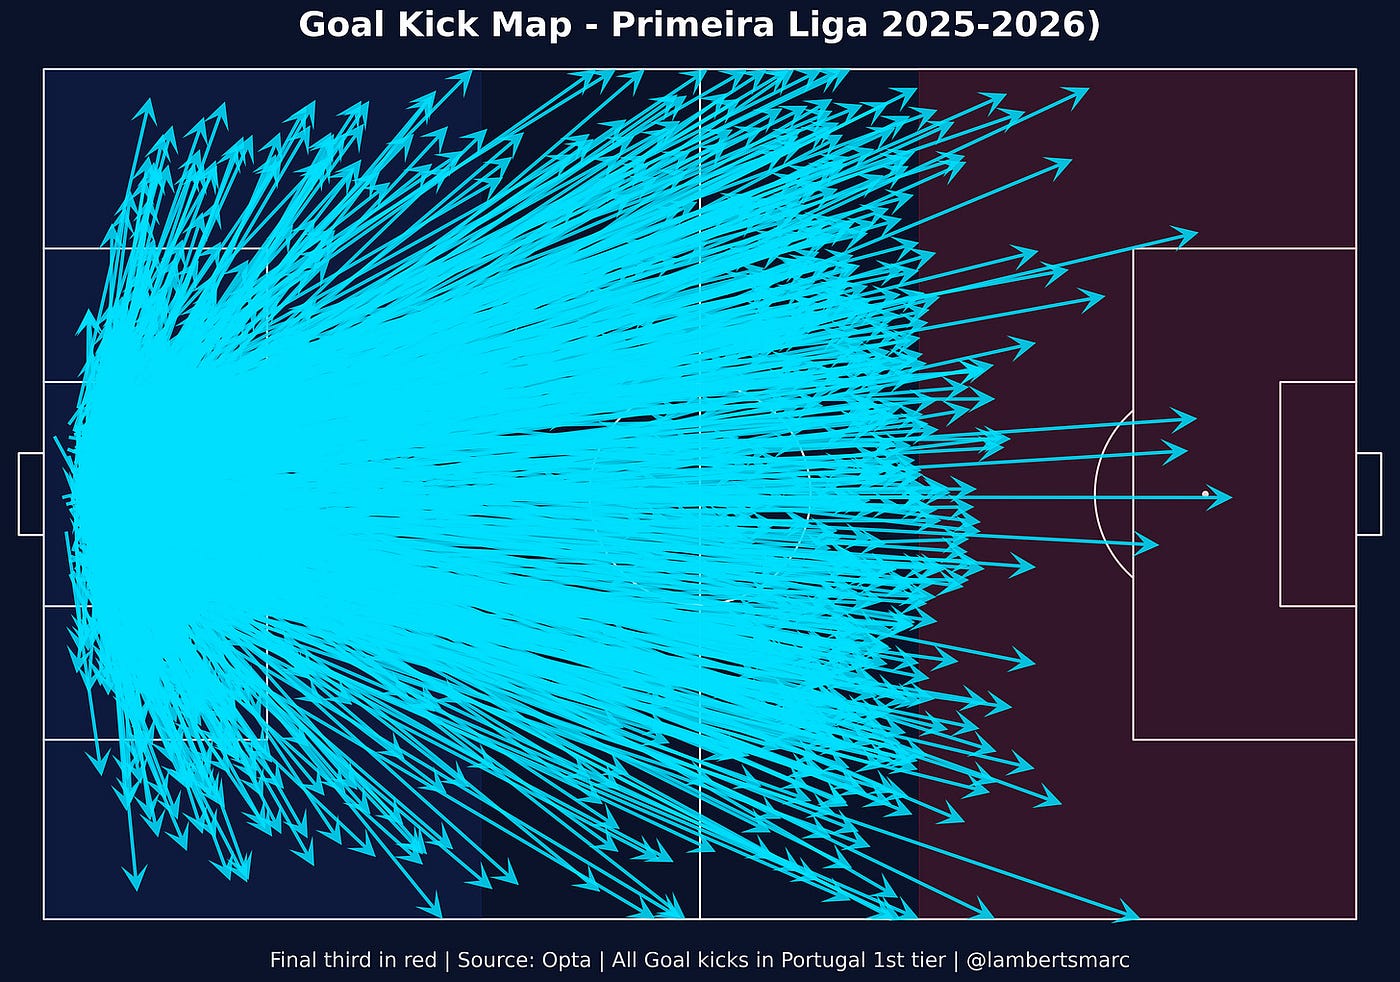
Goal kicks are conducted by the goalkeepers during this season. As you can see, the end locations are divided into many passes to the wide areas in the defensive and middle third, and the longer passes into the central areas of the pitch.
Deep free kicks
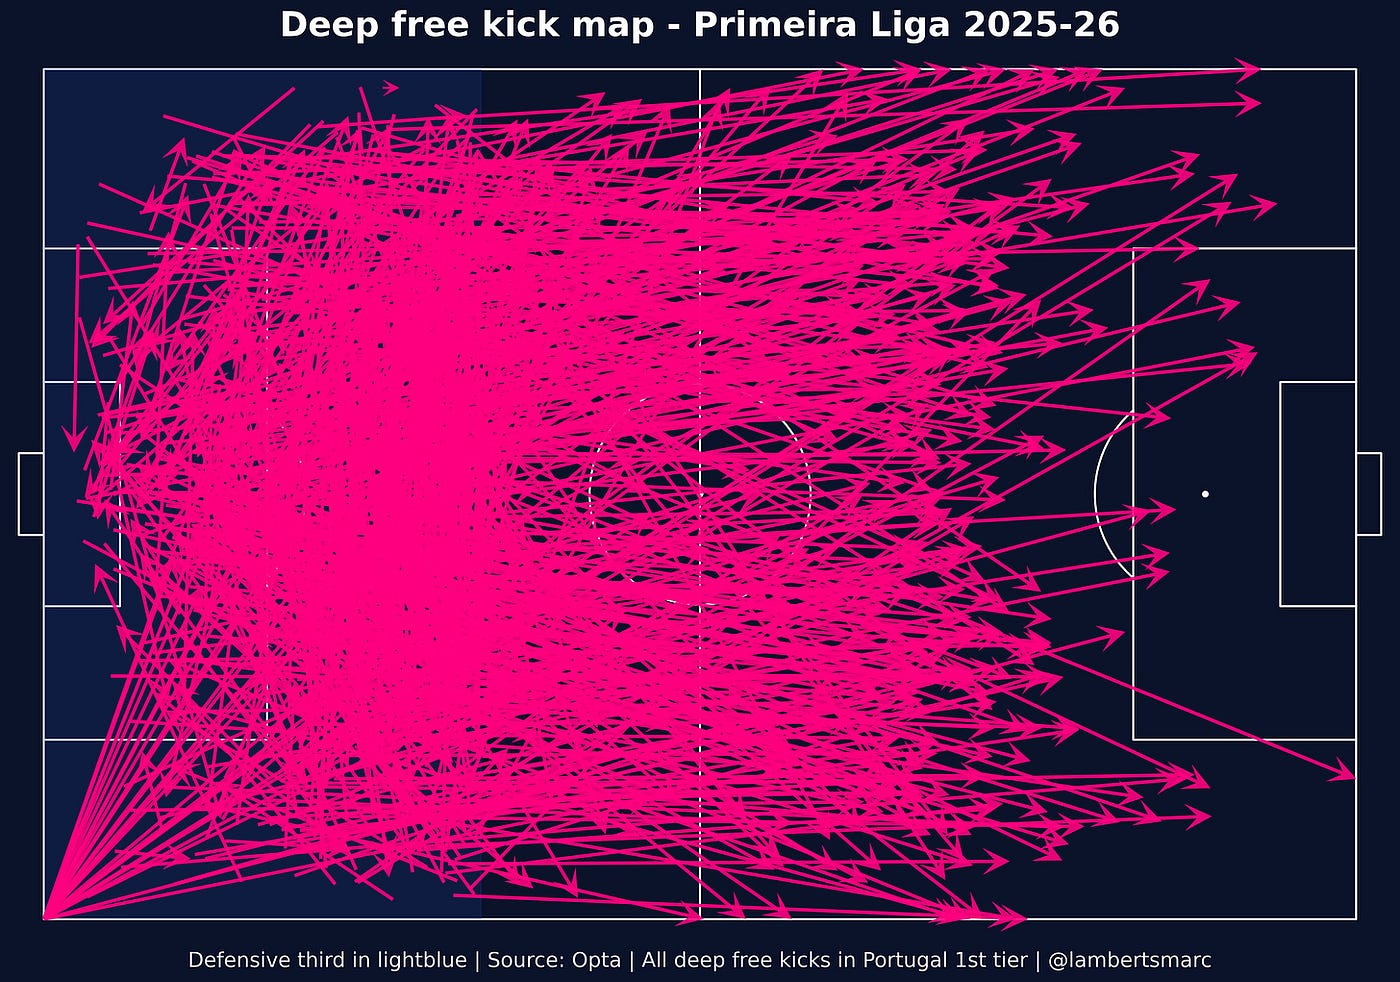
In the visual above, we see every free kick that was taken in the defensive third of the pitch. I chose deep free kicks because they start a possession like a restart, more than just an attacking free kick, which is often aimed at a direct free kick or second contact shot scoring, rather than advancement on the pitch.
Kick-off
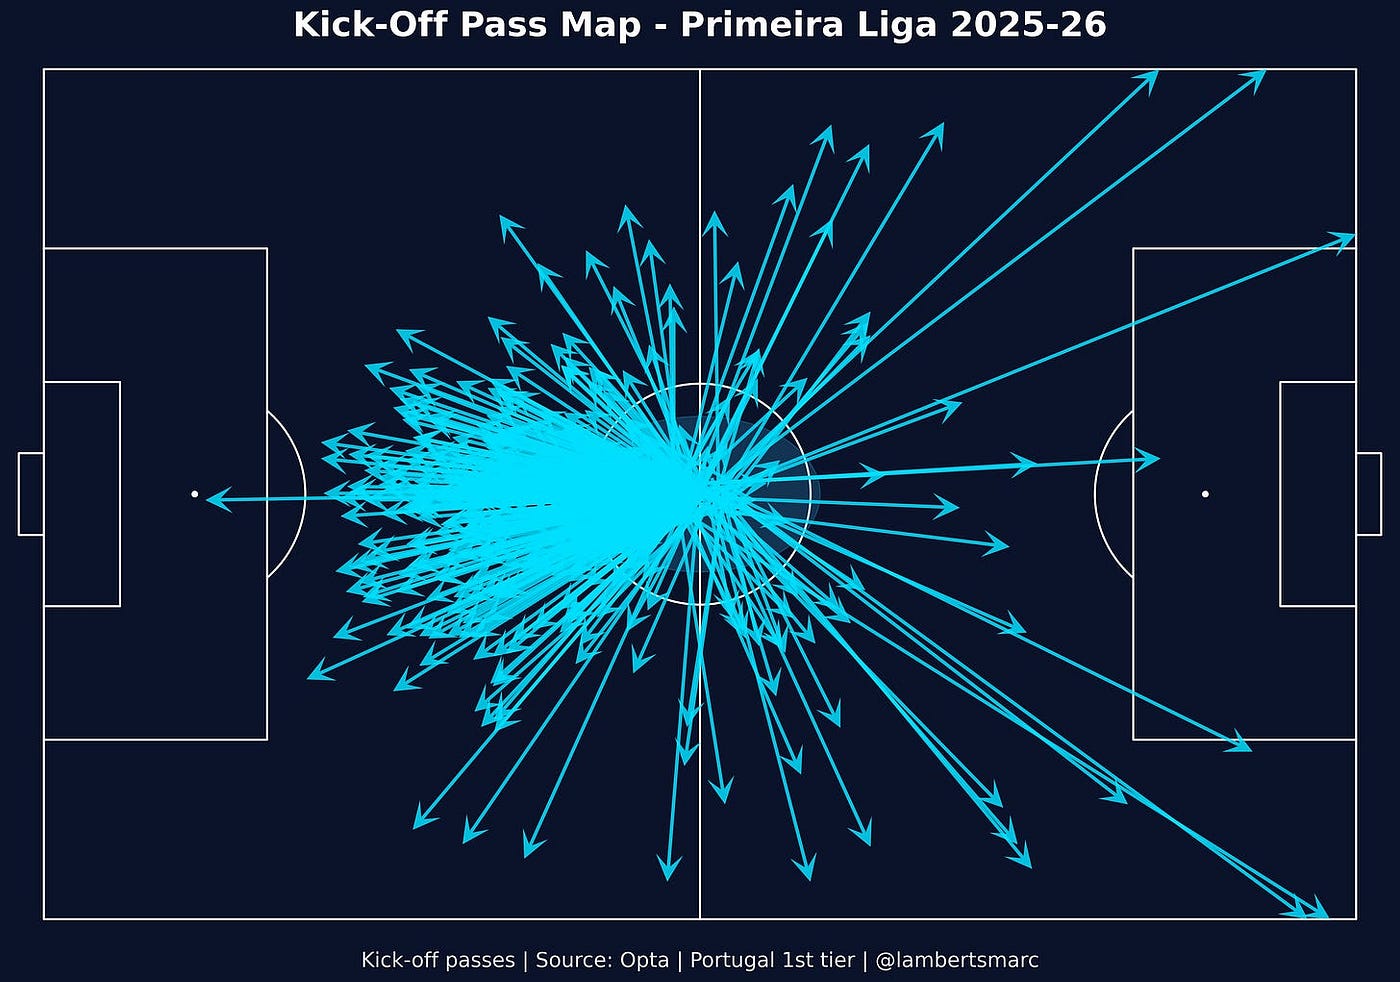
In the visual above, you can see the kick-offs taken during the season. While routines are limited in goalkicks, it’s a restart that determines how you are going to progress.
Defensive throw-ins
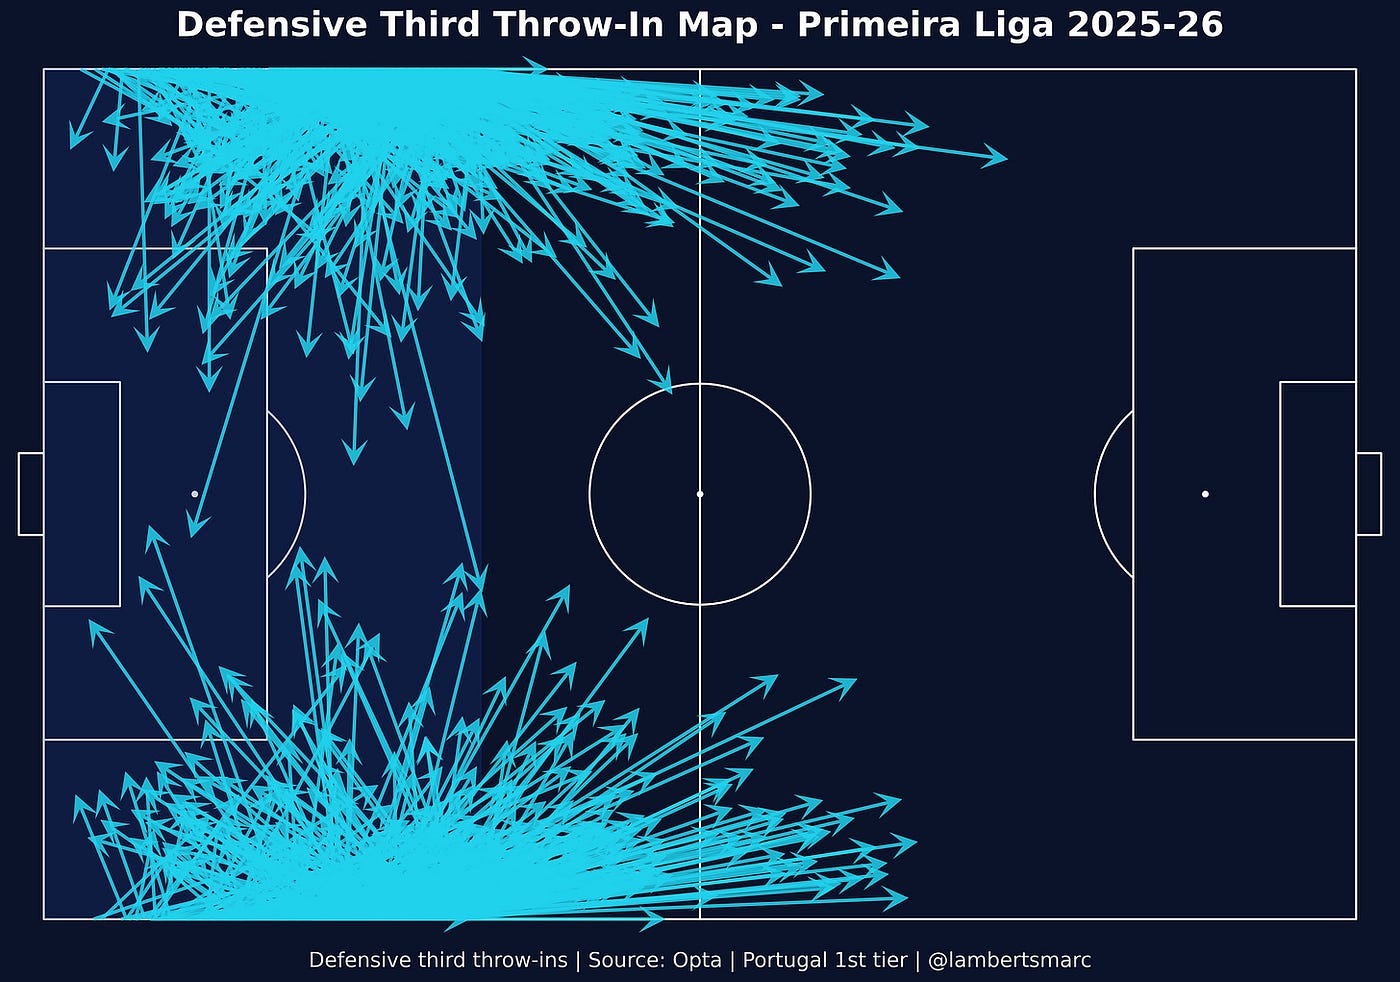
In the image above, you can see all defensive third throw-ins from the ongoing season. This shows how defensive third throw-ins are both progressiv,e as going lateral, suggesting retaining possession.
The possessions or plays now start with the above situations. The following step is to look at the end of the possession, which always should end in the final third. The end of the possession, either via carry or pass, always ends in the final third. We are looking at the sequence final third entries after specific start situations. So we define the plays from the above starting locations and what to find possession that ends in the final third.
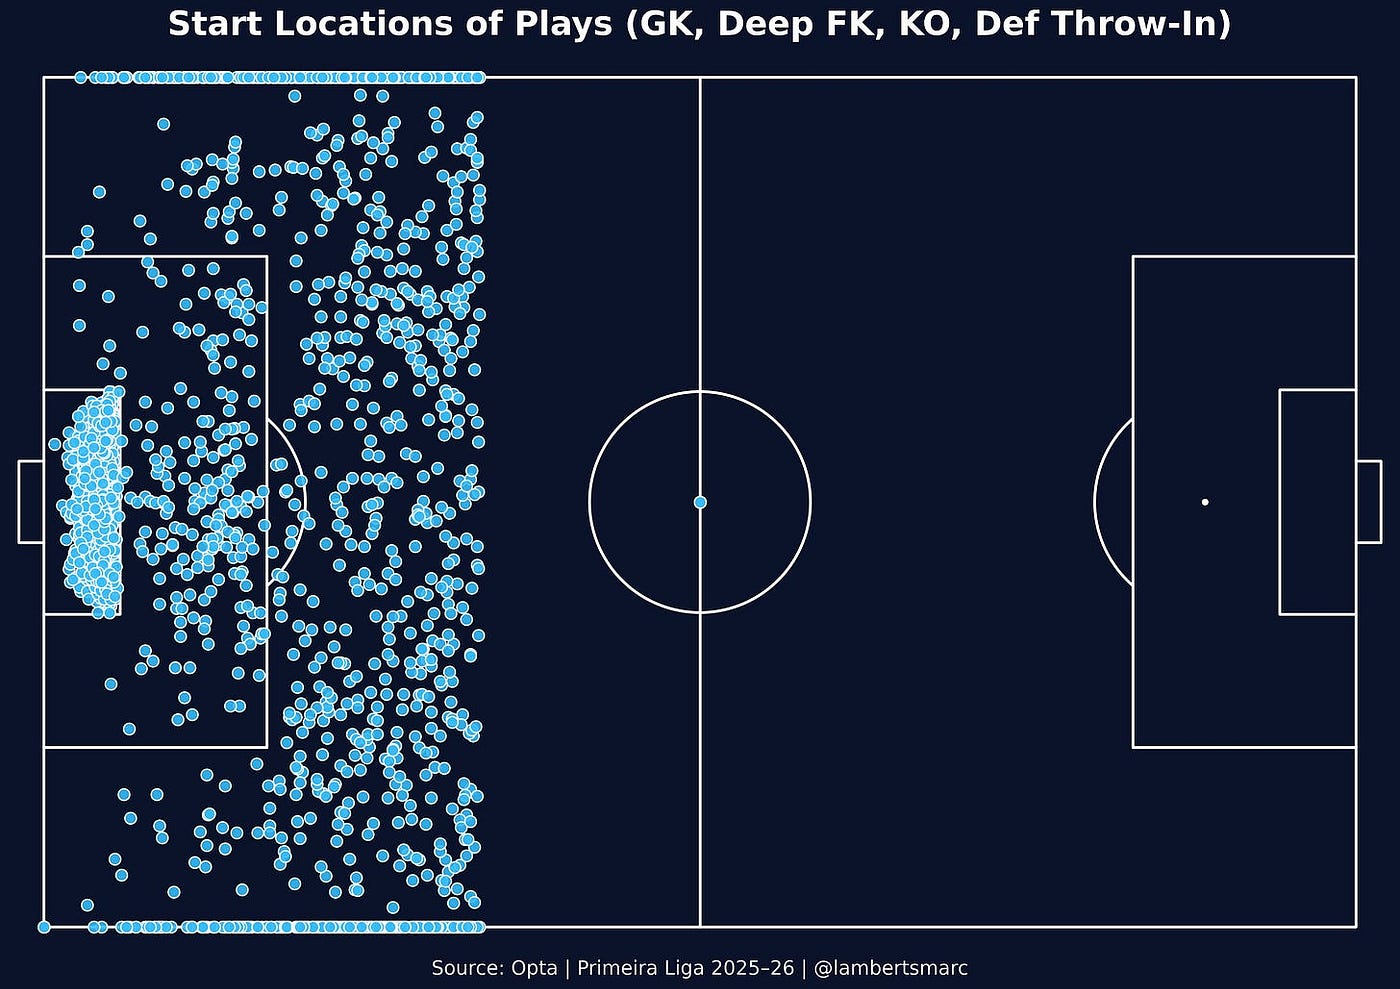
In the image above, you see the pitch with scatters. These scatters represent every starting location for a play. They are all in the defensive third, bar the kick-offs. We have defined these as such that it will take progression to the attacking third.

In the image above, you see the pitch with scatters in the final third. This represents the end locations of the plays during the 2025–2026 season in Primeira Liga and serves as the blueprint for our value mode. As you can see ,most of the plays end on the edge of the middle third, and the least end in the penalty area, close to the opposition’s goal.
We have now defined what plays are in football, adapted from NFL analytics. So, how do we go on and make a model for explosive models?
Explosive plays model
In the methodology above, we have seen what we define as plays and how they start. But I want to go beyond that and look at an important action. I want to see if the plays have an explosive nature. This means I’m going to look at the plays and flag when if there is a pass or carry that can be considered explosive.
Explosiveness here means:
- Exceeds 10 meters for a carry
- Exceeds 20 meters for pass
While I’ve defined plays as such, I am now going to focus on how explosive teams/players are and what value we can add to it. The following features are important:
1. Forward Progression
2. Total Distance
3. Zone Progression
4. Final Third Arrival
5. Action Type
6. Play Context
The Explosive Play Value Model measures how much impact each attacking action has in moving the ball into threatening areas. Every pass, carry, or restart is given a value between 0 and 1, showing how much it contributes to progressing play and creating danger. To do this, the model looks at several factors, including how far the ball travels, how much it moves forward, whether it shifts between thirds of the pitch, and if it ends in the final third. Each factor is given a specific weight, with the most importance placed on actions that push the ball forward or reach advanced positions. This approach helps separate safe or lateral movements from genuinely progressive plays that help a team advance up the pitch.
Once each action is scored, the results are normalised so that values fall on a clear 0–1 scale. Passes longer than 20 meters and carries over 10 meters are defined as “explosive,” since these are the moments that usually stretch opposition lines or turn defense into attack. By quantifying these events, the model highlights which restart situations, goal kicks, deep free kicks, throw-ins, or kick-offs most often lead to quick, dangerous progressions.
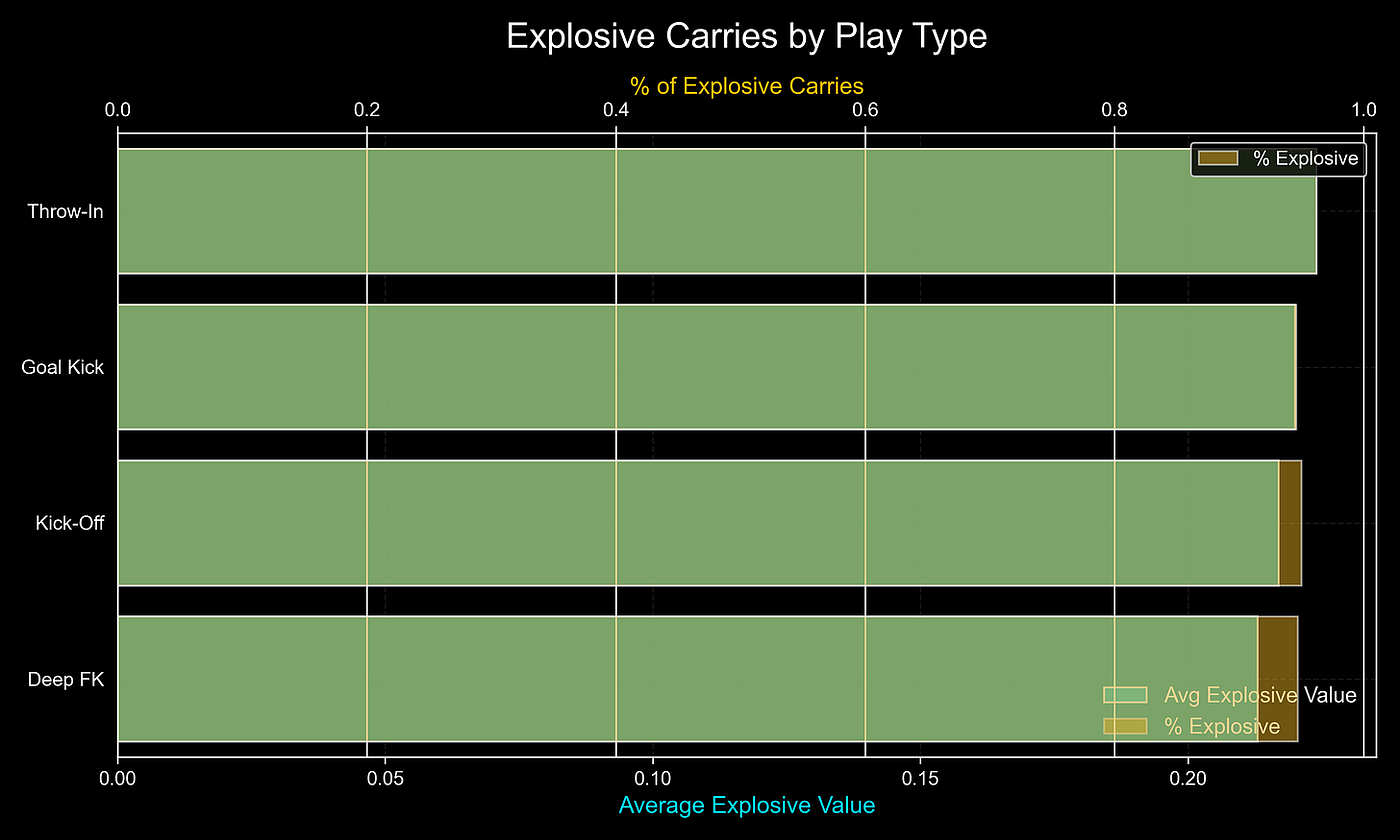
When we look at the different forms of play, which ones carry explosiveness?

In the bar graph above, we see very play type and how their average explosive value is. What we can see is that Goalkicks, Throw-ins and Kick-offs really have explosive value, looking at the percentage of the total. Explosive value is based on the total play, while % Explosive means that there are actual explosive passes in the plays.
So on the pitch, it looks like this:
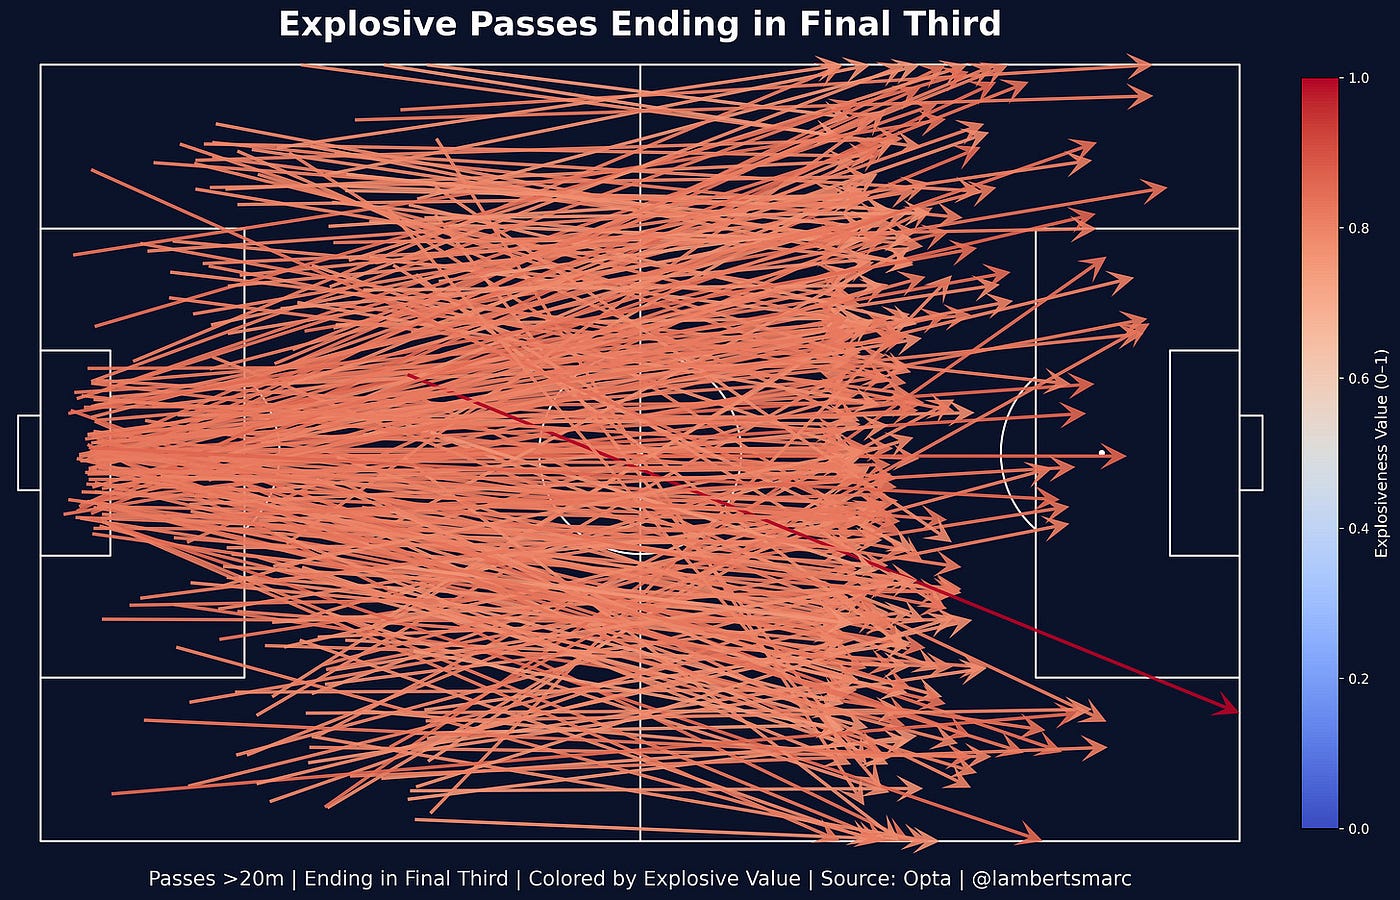
In we are looking at how plays (so all the restarts) and how passes come from those plays which are more than 20 meters, we see that these are the locations where passes occurred. Most passes have a value between 0.6 and 0.8 on the Explosiveness Value Model.
With Explosive carries — carries with more than 10 meters progression — we see something different. The percentage of actual explosive carries is only found in kick-off and deep FK, but their average value of the plays is much higher.
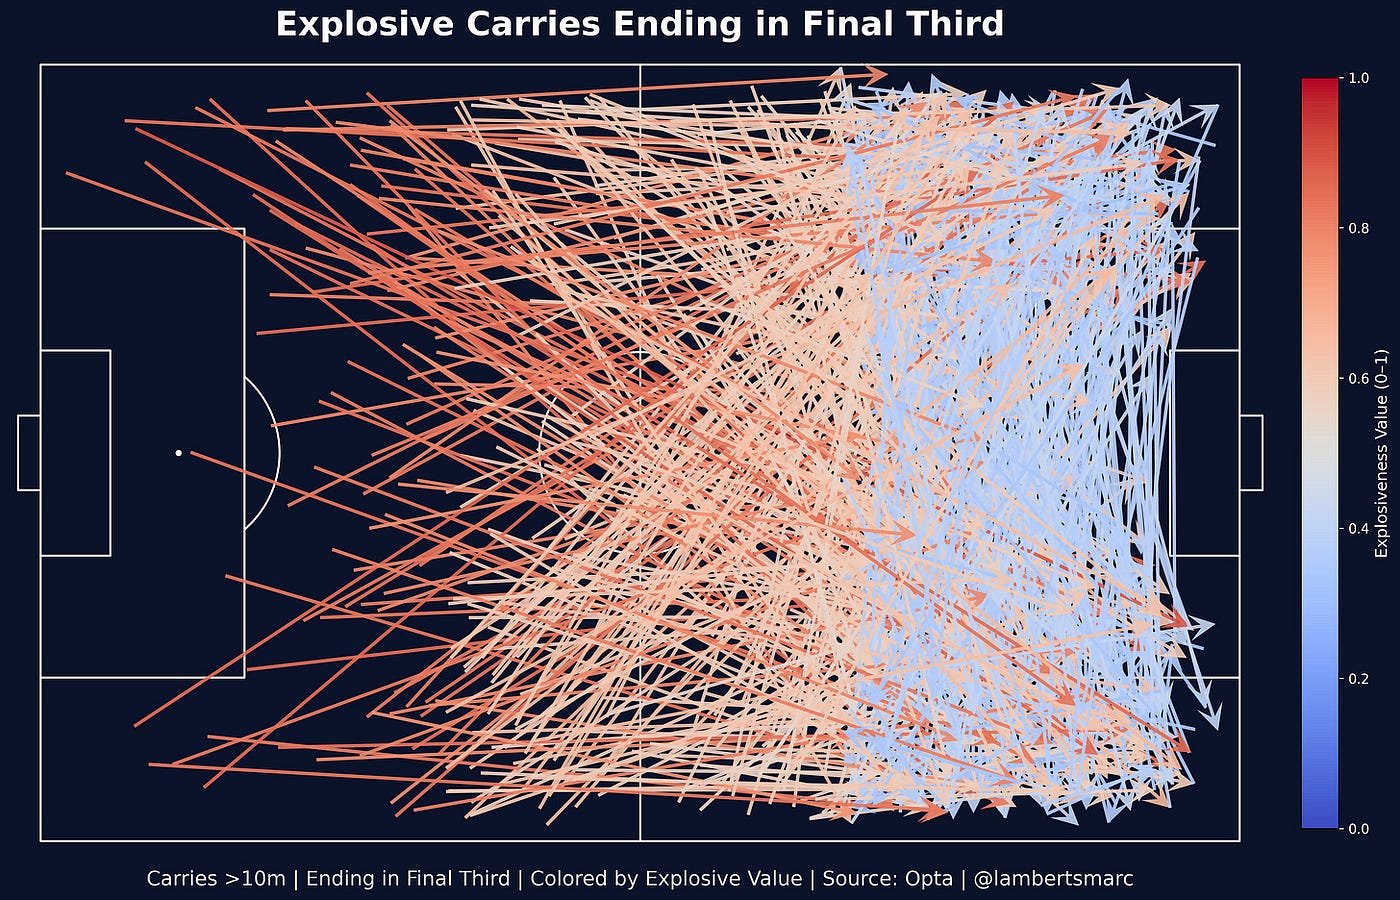
As you can see, there are fewer carries coming from the defensive third, but they are much more concentrated on the middle third and the attacking third. This also means that there is variance in the value of the different carries. This can be explained by the fact that the threshold of explosiveness is different (10+ meters) and the fact that carries also start higher and go sideways.
Best teams in Primeira Liga
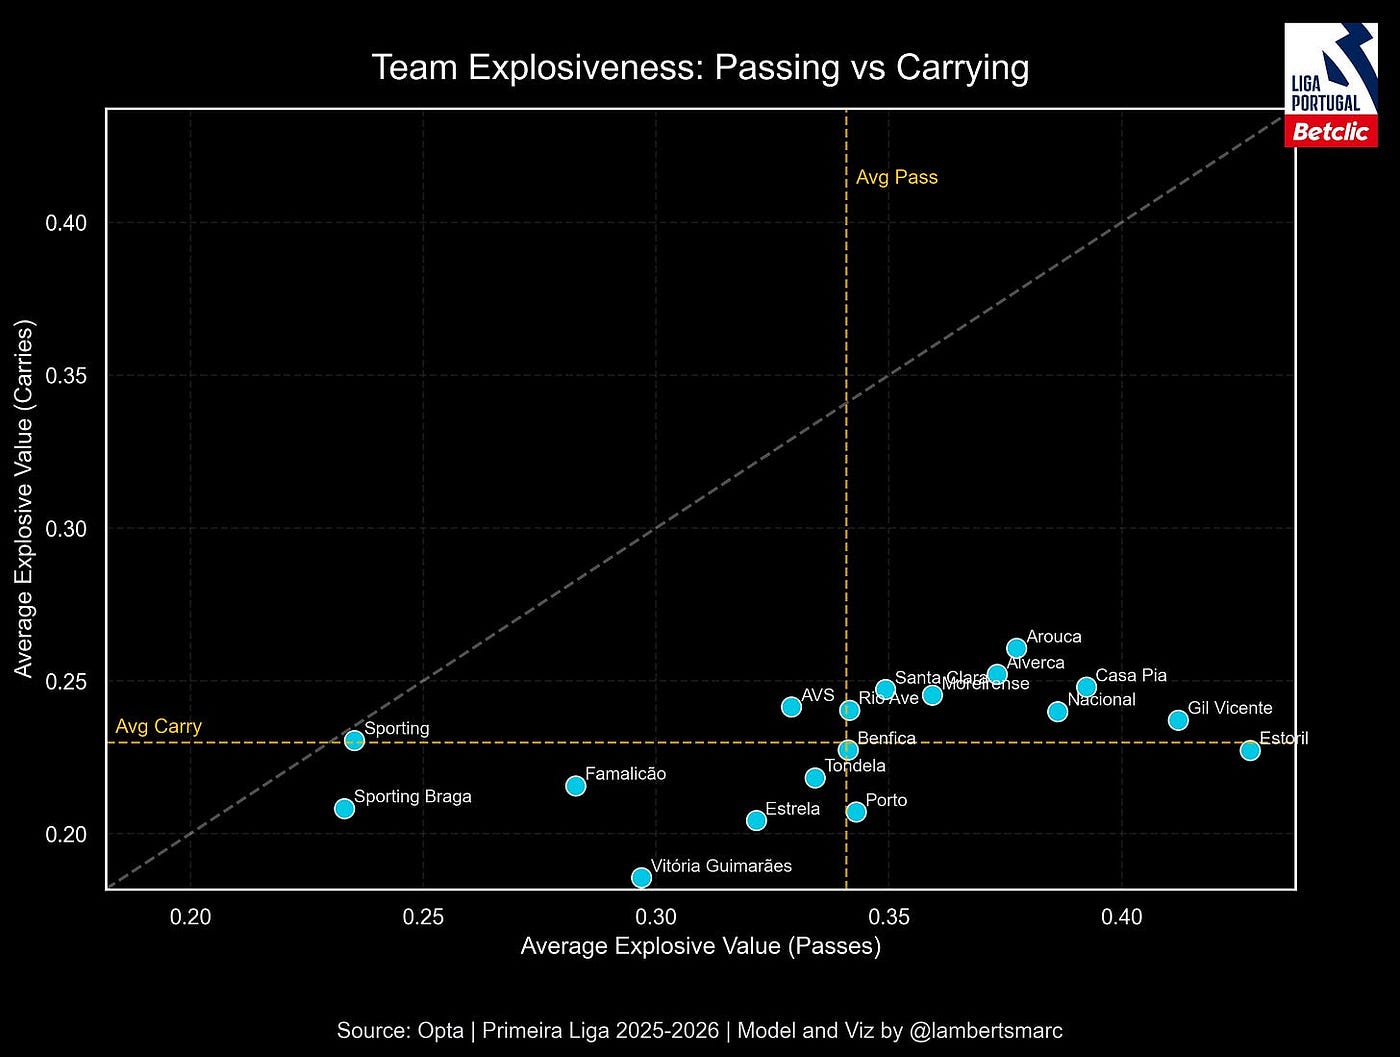
As you can see in the scatterplot above, the average explosive value per pass is higher than the average explosive value per carry. We have seen how that came to be by the pitches. What’s interesting here is that there is great variance in the explosive value of passes, but not so much in the carries.
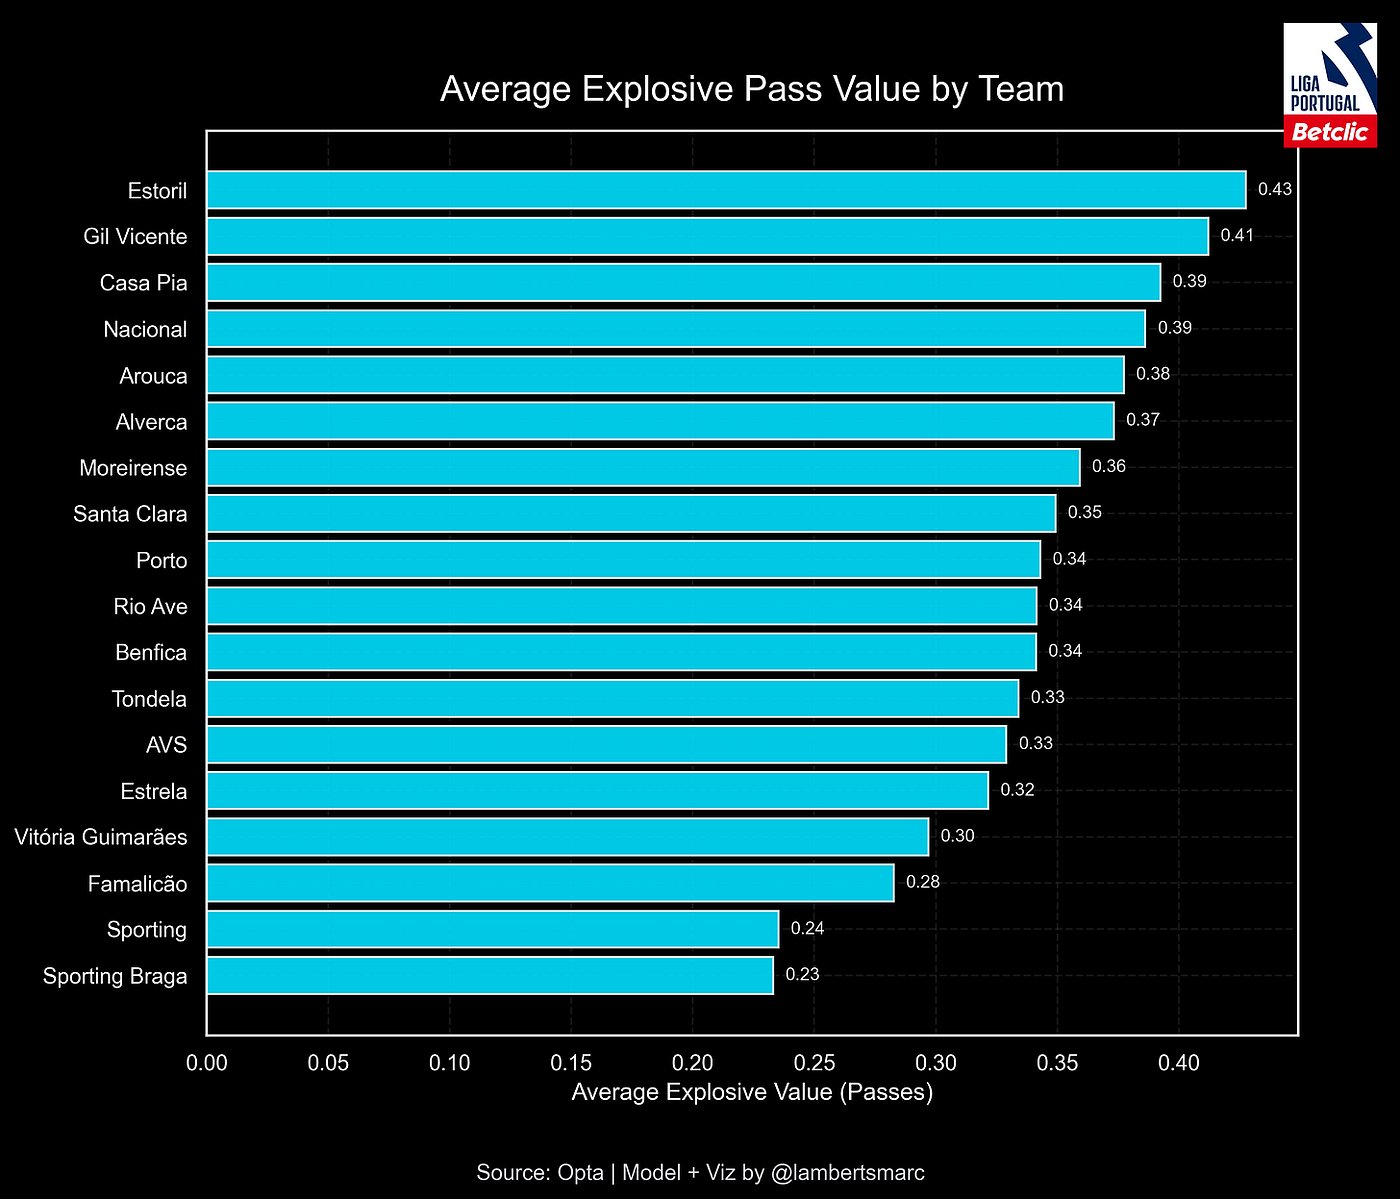
The biggest Explosive Value is held by Estoril, followed by Gil Vicente, Casa Pia and Nacional. The smallest value is held by Sporting Braga, followed by Sporting CP, Famalicao and Vitoria Guimaraes.

If we look at the carriers, we see that Arouca ranks highest, followed by Alverca and Casa Pia. On the botto,m we see Vitoria Guimaraes, Estrela and Porto.
Best players in Primeira Liga
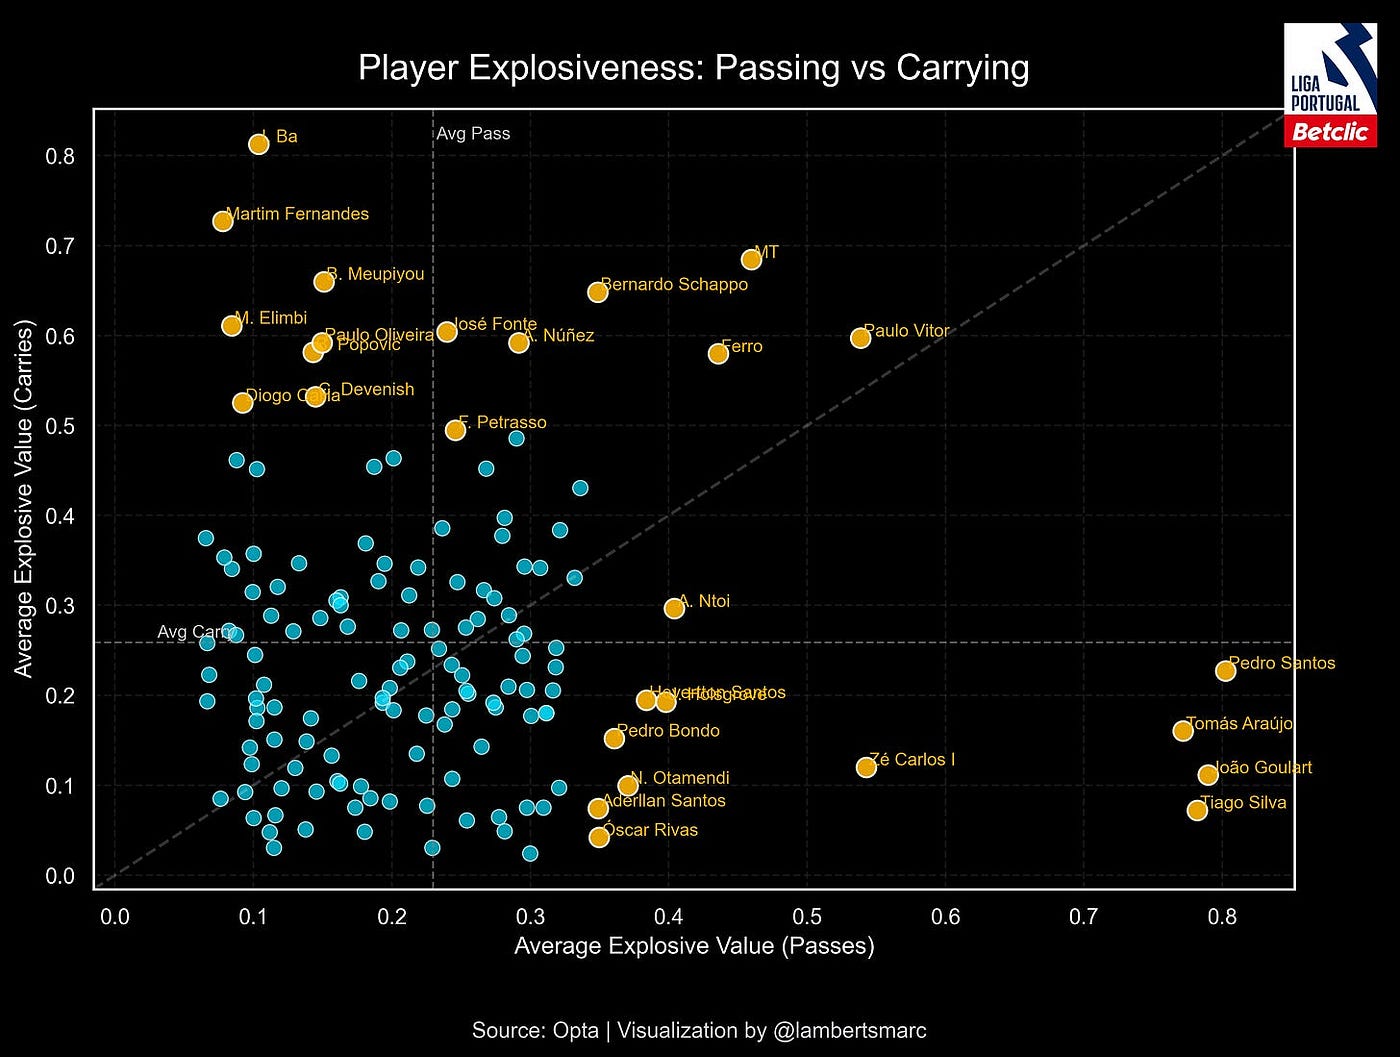
As you can see, we have plotted the players in this plot. All players who have either o carries or 0 passes have been excluded. The players in yellow oare utliers for either Explosive Values in carries or passes.
Now, if we combine both values, who are the most explosive players in the Primeira Liga?
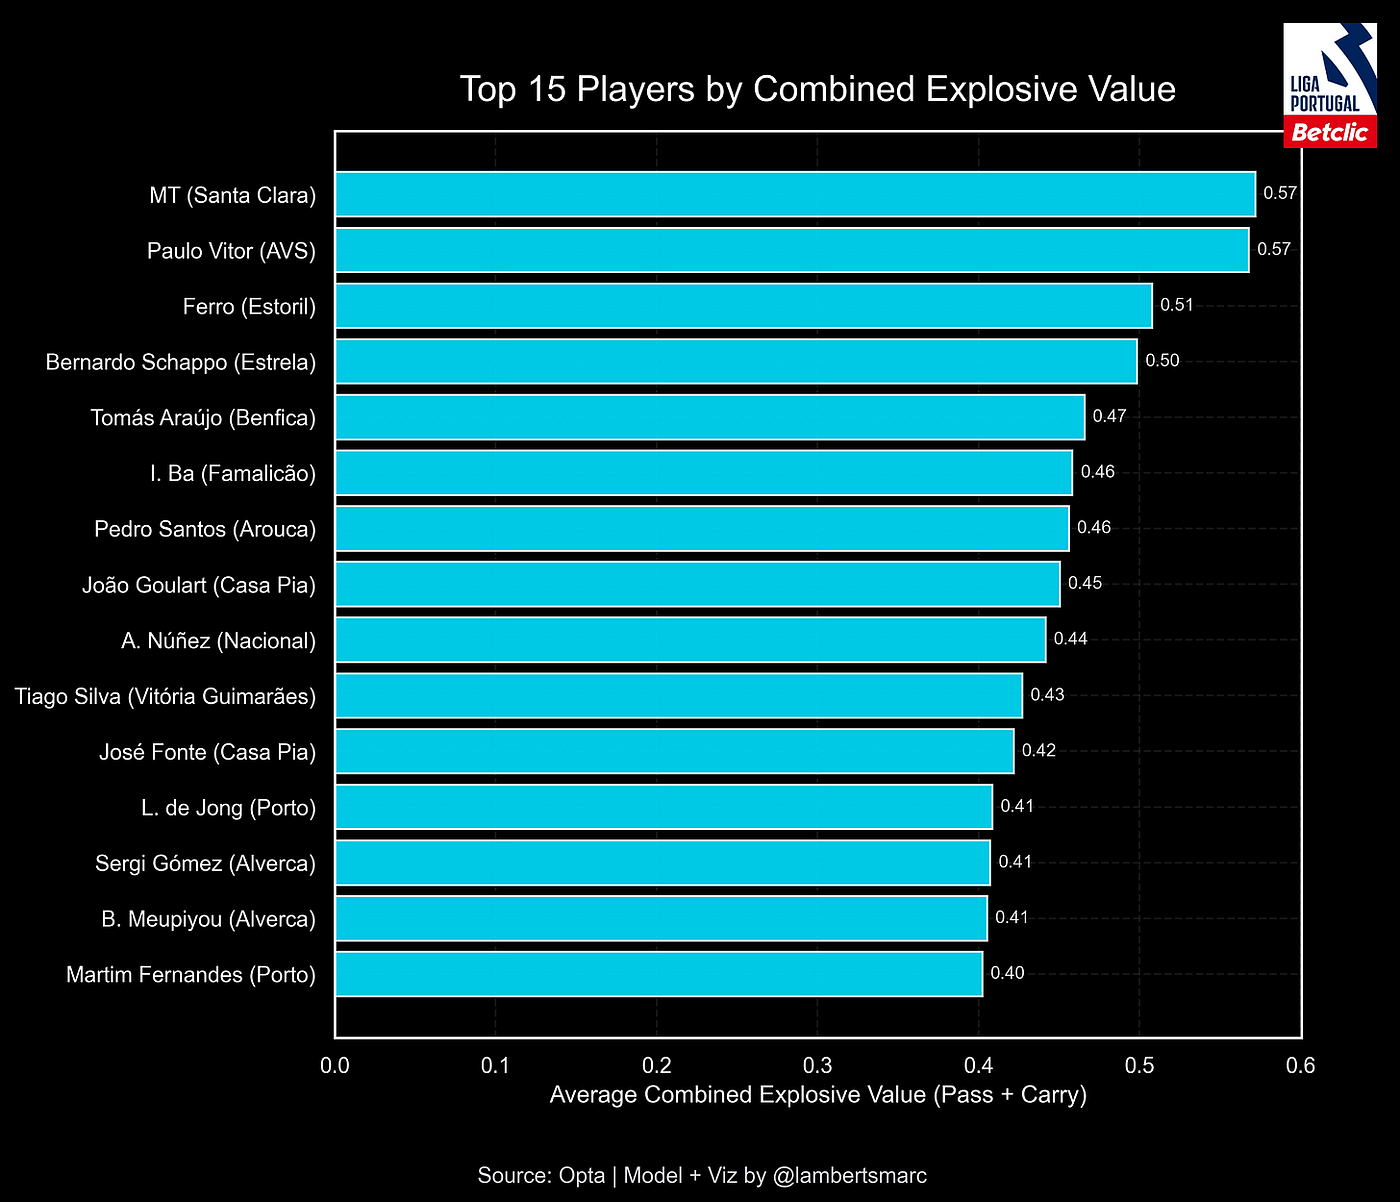
In this top-15 bar chart, we can see which players are scoring the highest on the Explosive Value. The best players according to this model are MT, Paulo Vitor, Ferro, Bernardo Schappo and Tomas Aurajo.
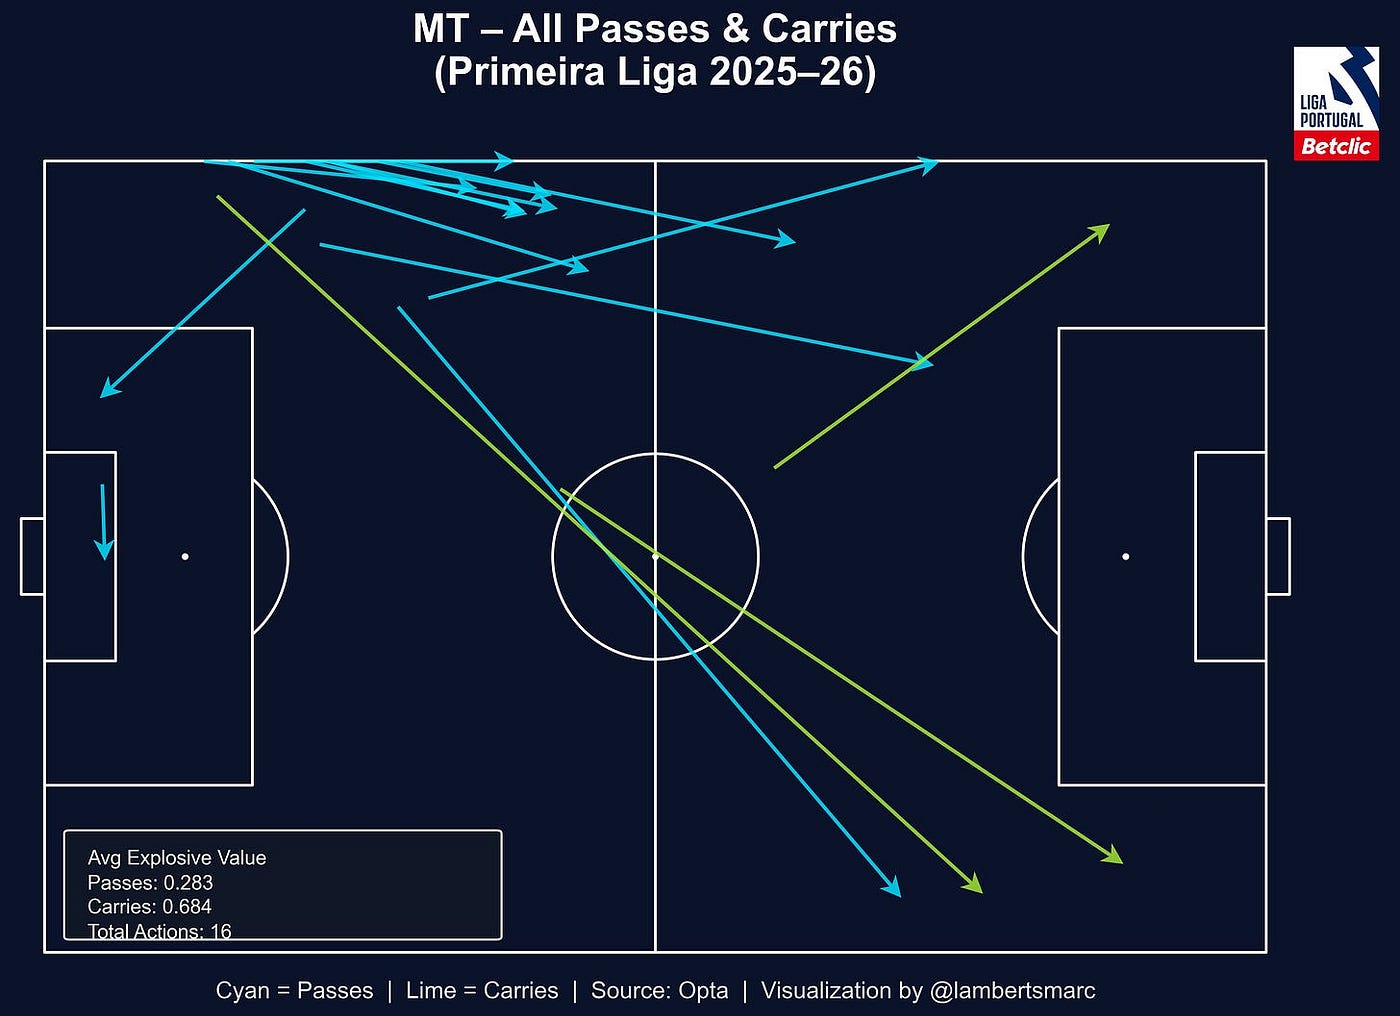
As the last part of it, we can then look at the pitch map of an individual player and see how they are doing in terms of passes and carries, but also the explosive value they bring to the pitch. In this case, MT, he has 16 actions that warrant an explosive score. He scores higher on carries than passes, so if you are looking for ball progression from plays, you want him carrying that ball.
Challenges
While the explosive value model offers a useful way to quantify how players and teams advance the ball dynamically, it does have several structural and contextual limitations. The biggest challenge lies in how event data simplifies the flow of play. The model also assumes that longer or more direct actions are always more valuable, which isn’t always the case tactically. Likewise, using thirds of the pitch as progress zones is a helpful approximation but misses finer spatial detail that shapes real threat creation.
The model also doesn’t yet account for context. There’s also the issue of sample bias: players with fewer recorded actions can appear overly “explosive” due to a small sample size. While the framework offers strong directional insights, it’s best viewed as a foundation.
Final thoughts
The explosive play model is a creative step toward translating raw event data into a more intuitive measure of impact. It bridges the gap between traditional counting stats and spatial analytics by emphasising progression, direction, and value. Although it still lacks contextual layers, the framework highlights underlying playing styles and player tendencies that are often hard to quantify.
In its current form, it’s less about perfect precision and more about perspective.
Citation
admin. (2025, oktober 19). Lessons from the NFL for football: Explosive Plays. Waltzing Analytics. https://waltzinganalytics.com/models/lessons-from-the-nfl-for-football-explosive-plays/