
I got to be honest with you, I have 37 projects which aren’t finished and are definitely in the midst of getting something tangible. And, a double truth here; I enjoy the process more than the finished product. Some finished products work and I will post them publicly, but most of them end up in a folder on my laptop with the idea that I might revisit them later (and sometimes I do!).
In this article, I want to acknowledge the process and look at an idea I had. How can we capture development or potential in aggregated data? In the end, my aim is to have an index value that gives an idea of how much a talent still can progress and whether talent turns into quality.
Data
The data is aggregated data and focuses on the Portuguese league of 2025-2026. The data was collected mid-November, so it might see any changes. However, this doesn’t matter for the research we are conducting.
I focus on CF/strikers only, which means each player that has played in that position. Further more I filter the data for a set of standard metrics: Age, Minutes played, Goals per 90, xG per 90, Shots per 90 and Shots on target, %. With this information we are going to start building.
I’m going to look at players with at least 300 minutes played, but I will also turn towards data per 30 minutes. The reason why? I can better compare players with fewer minutes played, which means they have the equivalent of 10 games when they have played 300 minutes. This gives a better idea in a smaller database or when we are working with youth/academy players – which ultimately is our goal.
Methods
Because this project involves multiple layers of calculation, transformation, and analysis, I chose to build the entire workflow in Python. This is simply the language I am most comfortable with for data manipulation and statistical modelling. Python offers a mature ecosystem that make it ideal for constructing metrics, analysing patterns, and generating visualisations.
Of course, the approach is not language-specific. The same methodology could be replicated in R, Julia, or even specialised analytics tools; many analysts working in academia or recruitment departments use R for its statistical depth or Julia for speed-heavy modelling. The key is not the language, but the structure and reasoning behind the metric.
To create a meaningful performance index, the first step was to ensure that the dataset was filtered in a way that preserves reliability. I only included players with at least 300 minutes played, ensuring the sample size is large enough to avoid extreme noise or misleading results. On top of that, I restricted the analysis to players listed as Center Forwards (CF). This position-specific filtering is essential: combining players across roles would distort the model by mixing responsibilities, tactical profiles, and performance expectations. After isolating the relevant population, I prepared the dataset for the next phase, feature engineering, where the raw data is transformed into more informative metrics that better reflect a striker’s decision-making quality, efficiency, and overall contribution.
Feature engineering
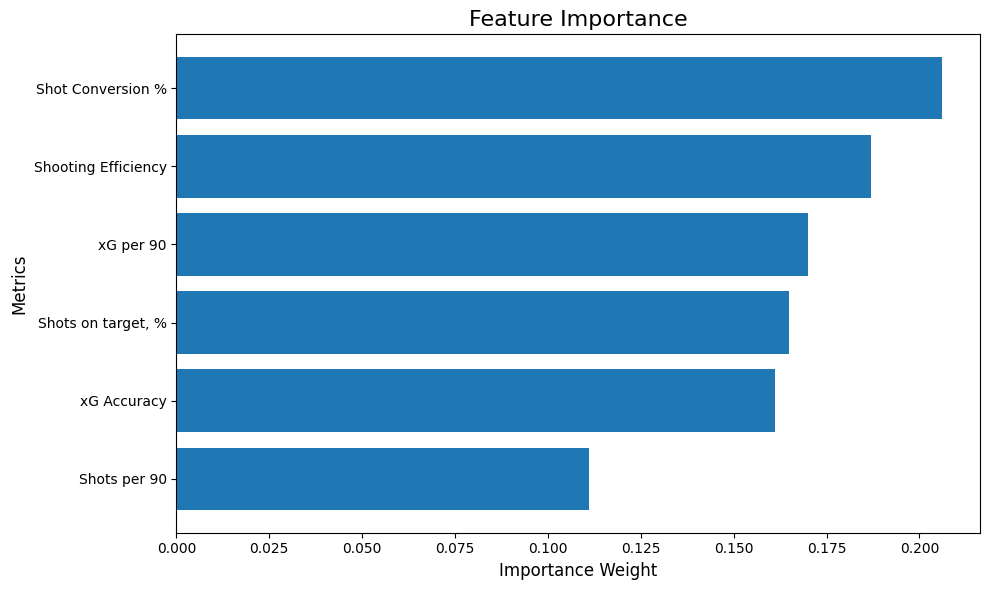
Raw statistics like goals, xG, or shots provide only fragments of a striker’s true profile. To make these numbers more informative, they were transformed into richer, rate-based indicators that capture efficiency and decision-making quality. The first, Shot Conversion %, measures how effectively a forward turns attempts into goals — a pure indicator of finishing precision. xG Accuracy compares actual goals to expected goals (xG), revealing whether a player consistently outperforms or underperforms chance quality. Finally, Shooting Efficiency blends accuracy and power by combining Shots on Target % with Conversion %, effectively reflecting how well a player not only hits the target but makes those shots count. Together, these derived features allow the model to assess how productive each attempt truly is, rather than just counting volume.
Normalisation & Weighting
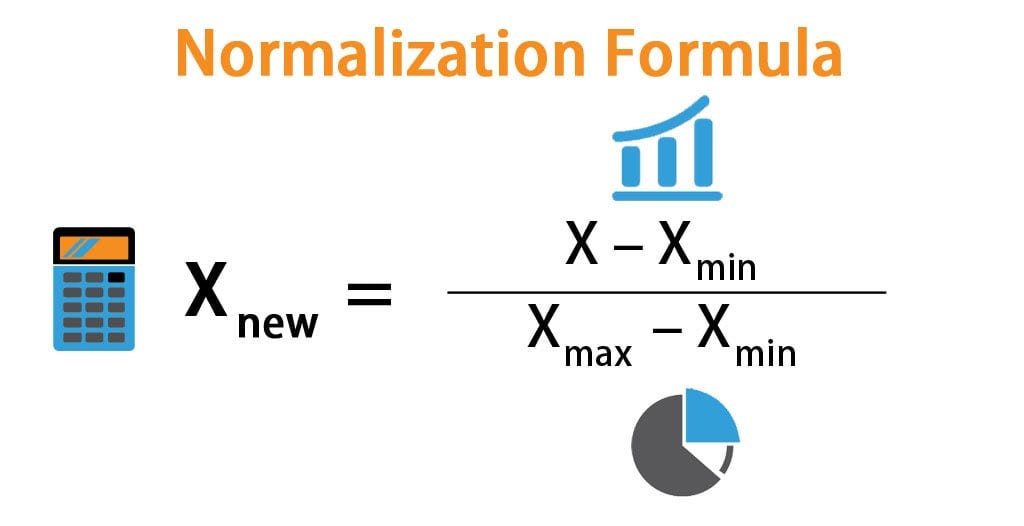
With these metrics living across different scales and distributions, it required a hybrid normalisation method that merges Min–Max scaling for interpretability and Z-score standardisation for outlier control. That way, truly exceptional players do not skew the scale, yet meaningful performance differences are conserved across the dataset. After normalization, each metric was given a dynamic weight corresponding to its statistical correlation with Goals per 90. Metrics strongly correlated, such as xG per 90 or Shots on Target %, were given more influence, while weaker correlations, like raw shot volume, were less influential. This procedure in turn makes the model self-adjusting, automatically configuring itself to each league’s playing style and scoring trends.
Base Performance Score (BPS)
All normalised and weighted variables are combined into a single composite, the Base Performance Score, or BPS. It is representative of the underlying attacking contribution of a striker, into one comparable number. The BPS is a foundation for all the subsequent variants of CFPI; it captures what the player does on the pitch, abstracting away from external context such as age or stage of development. It is, in essence, the raw number representing how well the forward executes the most salient aspect of his job: converting opportunities into goals with efficiency and consistency.
The Role of Age — CFPI Variants
Player performance is not static, a striker at 19 and a striker at 29 may produce similar raw outputs, yet the interpretation of those outputs should not be the same. To account for this, the model introduces age-adjusted variants of the CF Performance Index (CFPI) that contextualise performance relative to a player’s developmental stage.
The CPFI – Young version rewards young players (particularly those under 23) who are performing at or above senior-level standards. The logic is simple: if a young forward is already producing efficiently, this is a strong signal of future potential. Conversely, the CPFI – Mature variant places value on the stability and refined decision-making of more experienced forwards, especially those between 25 and 30 — typically the age band associated with peak output for strikers. To provide a neutral middle ground, a Balanced CFPI takes the average of both, offering a more rounded perspective. On top of this, a Consistency-Adjusted CFPI multiplies the balanced score by a consistency factor, rewarding players who maintain high levels of accuracy and reliability. This ensures that the model does not simply celebrate spikes in performance but recognises repeatability — the attribute that differentiates a streak from genuine quality.
Introducing the Emergence Index
While the CFPI variants measure how good a striker is right now, the model also aims to illuminate where a striker might be heading. This is where the Emergence Index comes in. This is a metric designed to capture a player’s upward trajectory relative to their expected maturity curve.
The idea is straightforward: compare a player’s youth-weighted score and their maturity-weighted score, then incorporate consistency to temper volatility. In mathematical terms:
Emergence Index=(CFPIYouth−CFPIMaturity)
A high Emergence Index indicates a young striker outperforming what would normally be expected at their age. Which would be a sign of breakout potential. A low or negative value suggests the opposite: an experienced player whose maturity and reliability currently outshine any youth-based upside. Those near zero typically track closely with age expectations, neither emerging nor declining relative to peers.
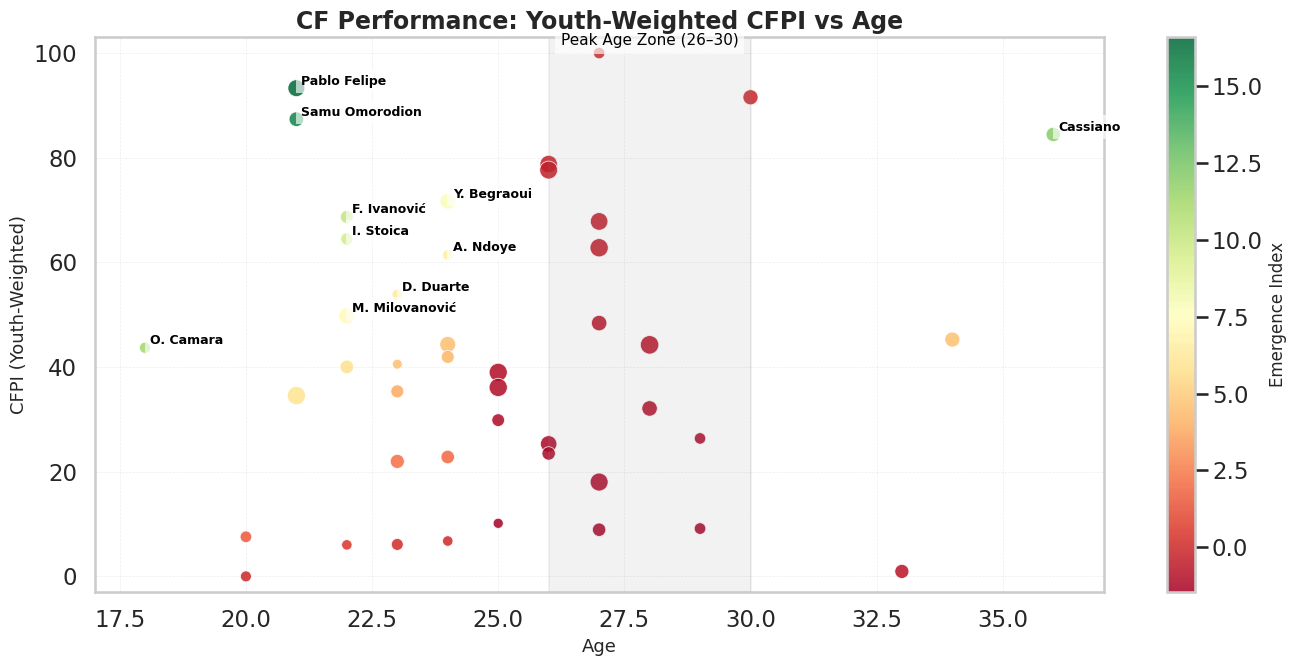
In the image above you can see the players with their ages on the x-axis, while we have the Youth-weighted CFPI on the y-axis. What we see here is that the players with the highest CPFI adjusted for youth, also are the players that are between the ages of 17 and 22 – which is obvious, since it’s weighted for youth. It shows signs that these young players have potential in the grand scheme of things.
Case study: Young Players
So what does this look like if we focus on the strikers that are young and we want to capture potential? In the image above, we see colored values for the Emergence Index. What’s the Emergence Index?
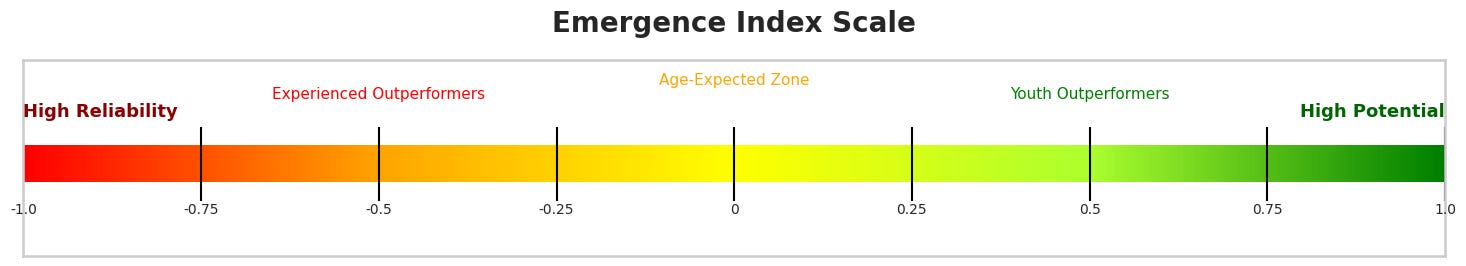
The Emergence Index measures how much a player is outperforming or underperforming what is normally expected at their age. It compares a player’s youth-weighted performance score with their maturity-weighted score to reveal whether they are trending upward or downward relative to age norms. High values indicate young players exceeding typical development curves, signaling strong breakout potential. Low or negative values reflect experienced players whose reliability outweighs any remaining upside.
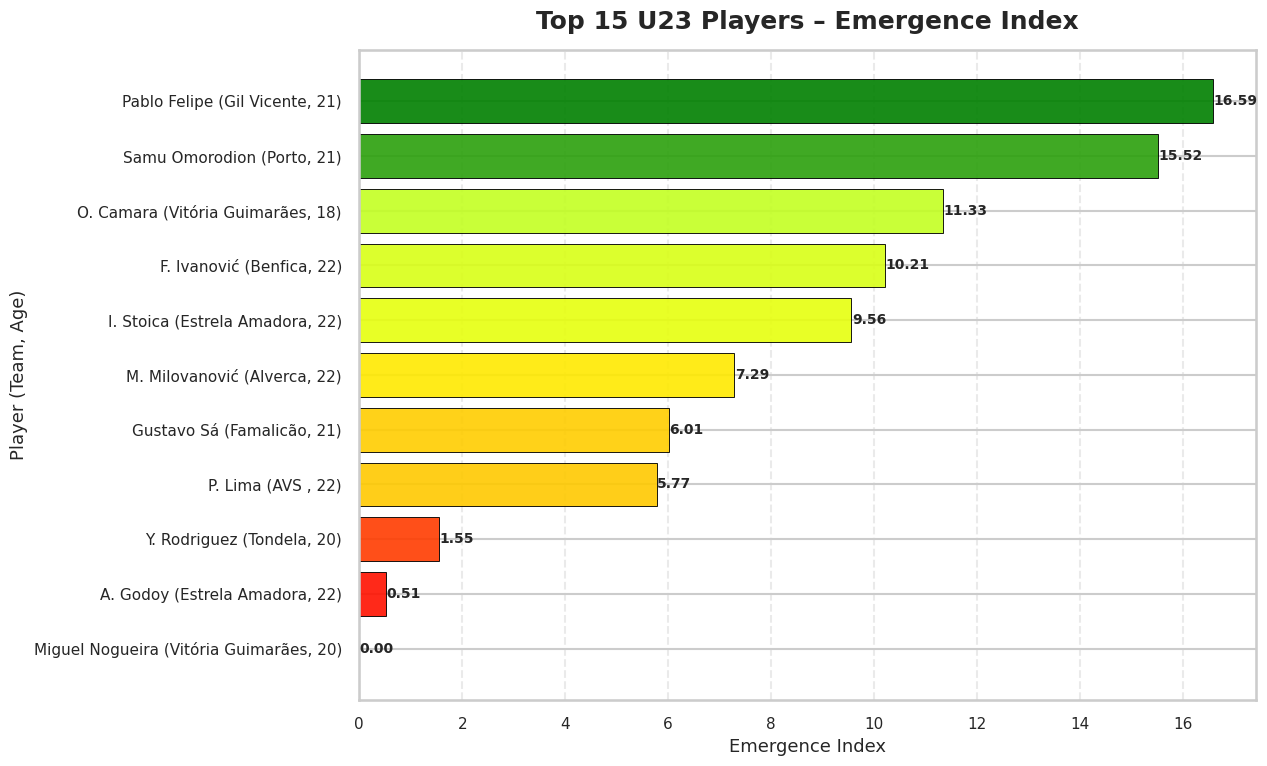
In the bar graph above we can see the top 10 players in terms of the Emergence Index. This shows the performance versus the age for players under 23. These players have an indication that they perform very well for their age in relation to the total database.
Key Insights & Findings
Some interesting patterns emerged once the CFPI and Emergence Index were applied to a real dataset. Perhaps the most striking was the discovery that xG per 90 and Shots on Target % consistently held the strongest correlations with goal output, more so than raw shot volume. What this suggests, in other words, is that chance quality and precision matter far more than simply taking many shots. This supports the notion that efficient, thoughtful forwards tend to outperform high-volume shooters.
The top Emergence Index players were often forwards aged 18–22 who outperformed their expected xG and boasted high shooting efficiency. These players are the archetype “breakout candidates”. Athletes whose metrics indicate that they may soon be in line for bigger roles, transfers, or developmental investment. On the other hand, veteran strikers, especially those 27+, often ruled the Maturity-Weighted CFPI. What they lack in pure technical ability, they more than make up for with experience-based consistency, especially in terms of things like xG accuracy and stability of finishing.
This dual view-current performance versus future trajectory-provides a more complete picture of striker quality than any single metric could. It gives analysts the capability to ascertain both the most reliable forwards today and the players most likely to become valuable assets tomorrow.
Citation
admin. (2025, november 14). A mid-process metric: Emergence Index: Introducing a work in progress in measuring development in football. Waltzing Analytics. https://waltzinganalytics.com/years/2025-years/a-mid-process-metric-emergence-index-introducing-a-work-in-progress-in-measuring-development-in-football/