
I don’t think I have to tell you that I love set pieces. The whole reason I started looking at data metrics and models more, was the fact that I felt that there are so few metrics concerning set pieces. I think that’s still the case, but we are getting that there, one day at the time.
In this week’s article I want to look deeper into the teams in women’s football that create the most dangerous from attacking set pieces. That’s why I have structured the piece as follows:
- Data
- Expected goals focused on set pieces
- 3.1 Corners
3.2 Free kicks
3.3 Throw-ins
Data
The data, well the raw event data, comes from Opta/StatsPerform and was updated on October, 1st 2025. This data contains all on-ball events during the games for both teams. The leagues we are focusing on here are the WSL, Frauen-Bundesliga, Premiere Ligue, Liga F and Eredivisie.
The expected goals model is my own model and uses different variables from the raw data to convert shot locations and shots into shots with expected goals values.
Expected goals focused on set pieces
Before we go into the actual analyses I think it’s good to know that the model specifies for different type of plays. I want to make a distinction between open play and set pieces, in which these are the variables that consist of set pieces:
- Corners
- Freekicks (indirect-freekicks)
- Throw-ins
These are called FromCorner, DirectFreeKick, SetPiece, Penalty, or Throw-In. That’s where we focus our expected goals on.
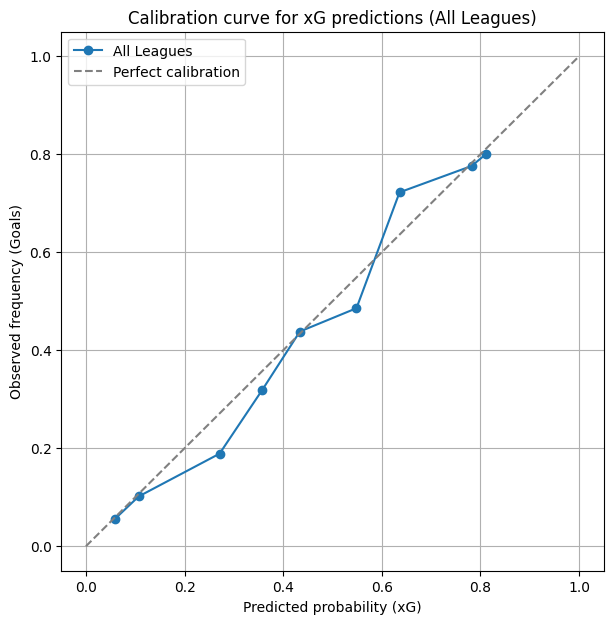
We first have a look at our model: how reliable is it? In the visual above you can see how the predictions compare to the actuals. My Brier score is 0,081 and my ROC AUC is 0,748
- Brier score = accuracy of the predicted probabilities → mine is low, so xG is well-calibrated overall.
- ROC AUC = ability to rank shots by likelihood → mine is solid but leaves room for improvement.
- Combined, it suggests my xG model predicts reasonable probabilities but sometimes misses the exact ranking of higher vs lower probability shots.
Now we can focus on the analysis.
Corners
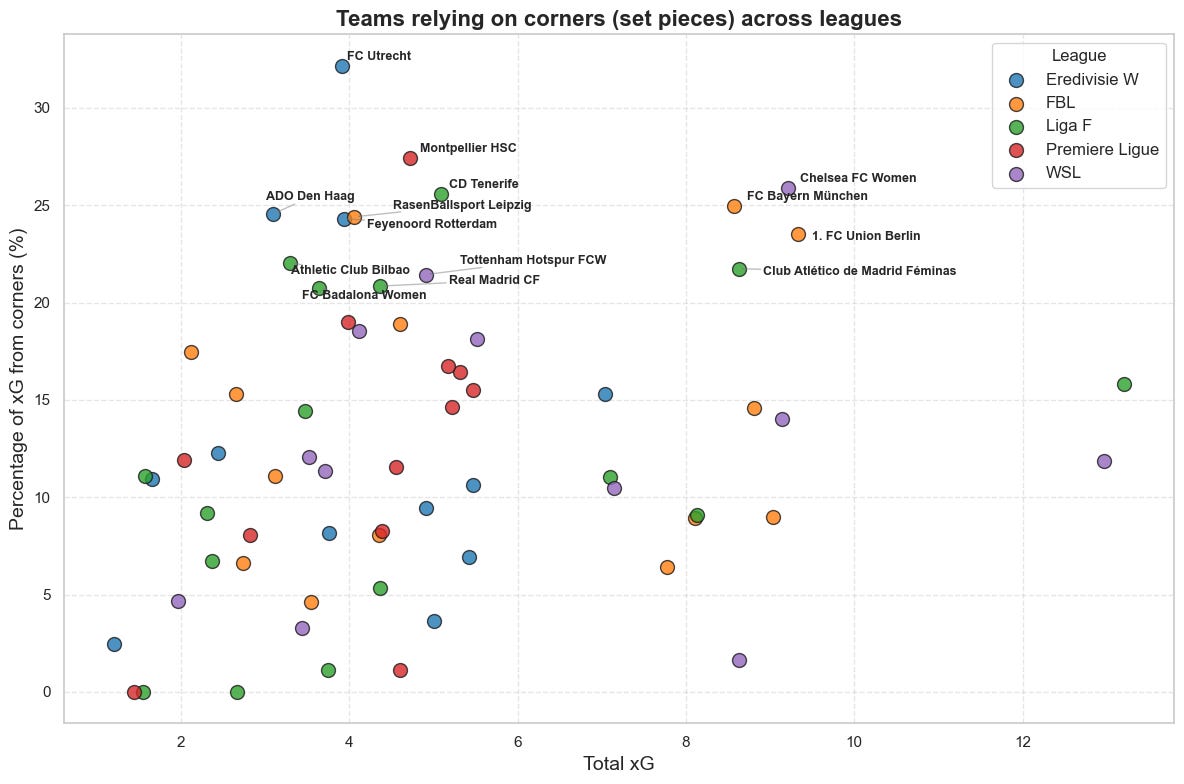
In the scatterplot above you can see the total xG amount of teams in the Eredivisie, Frauen-Bundesliga, Liga F, Premiere Ligue and the WSL. The top performing teams are represented above top 20%, with most teams coming from the Liga F. We look at what percentage of their total xG comes from corners/
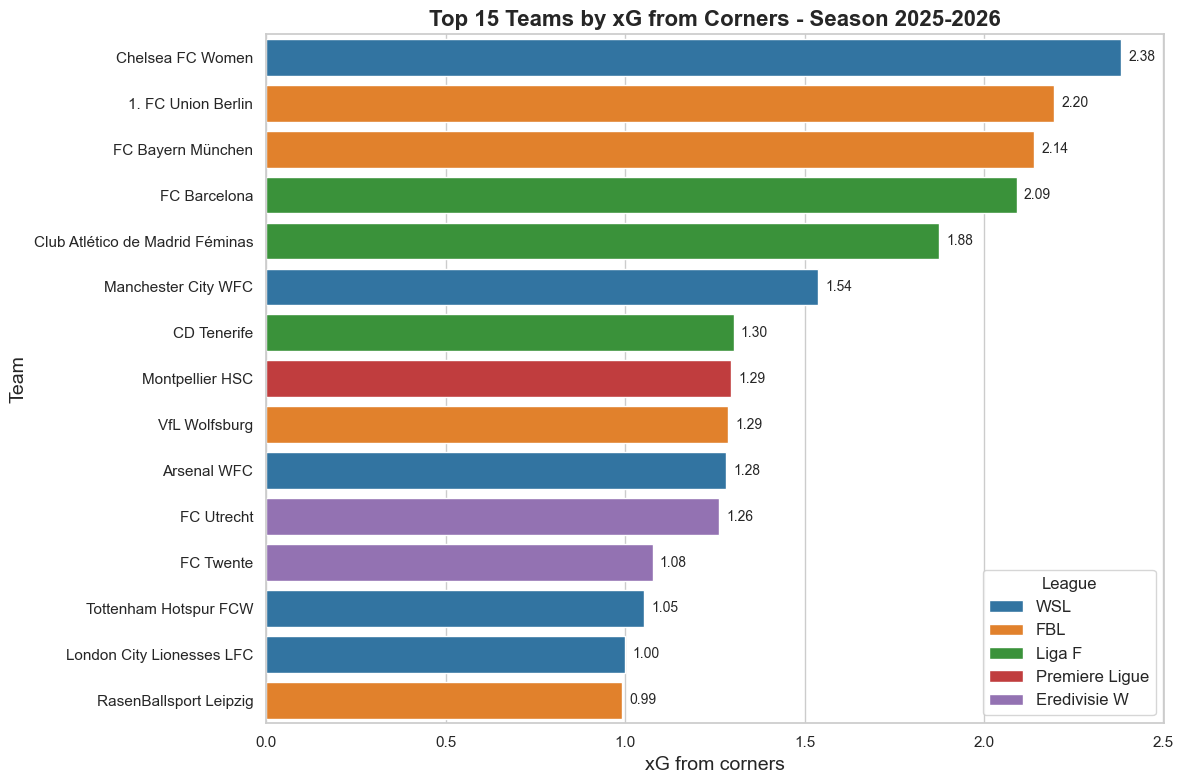
When we look at the best performing teams in terms of xG from corners, we see that Chelsea leads, followed by Union Berlind and Bayern München.
Freekicks
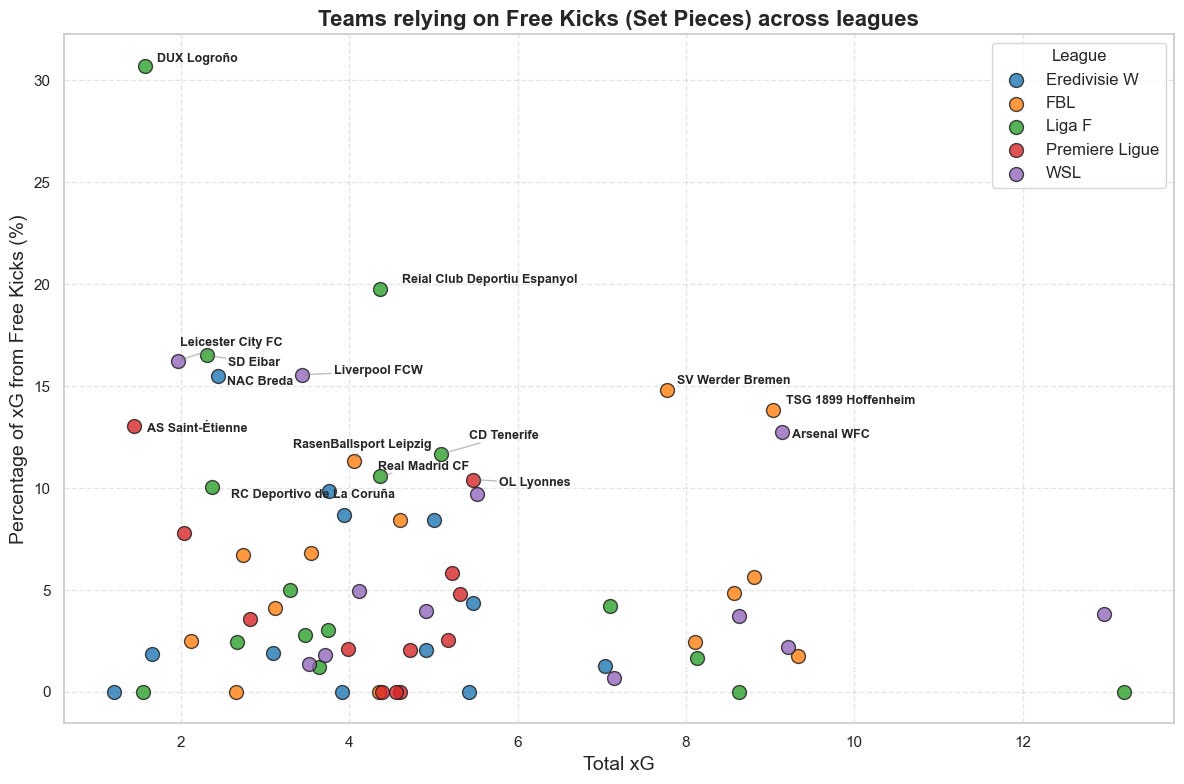
In the scatterplot above you can see the total xG amount of teams in the Eredivisie, Frauen-Bundesliga, Liga F, Premiere Ligue and the WSL. The top performing teams are represented above top 10%, with most teams coming from the Liga F. We look at what percentage of their total xG comes from freekicks.
DUX Logrono really relies on freekicks with over 30%, that’s insane!
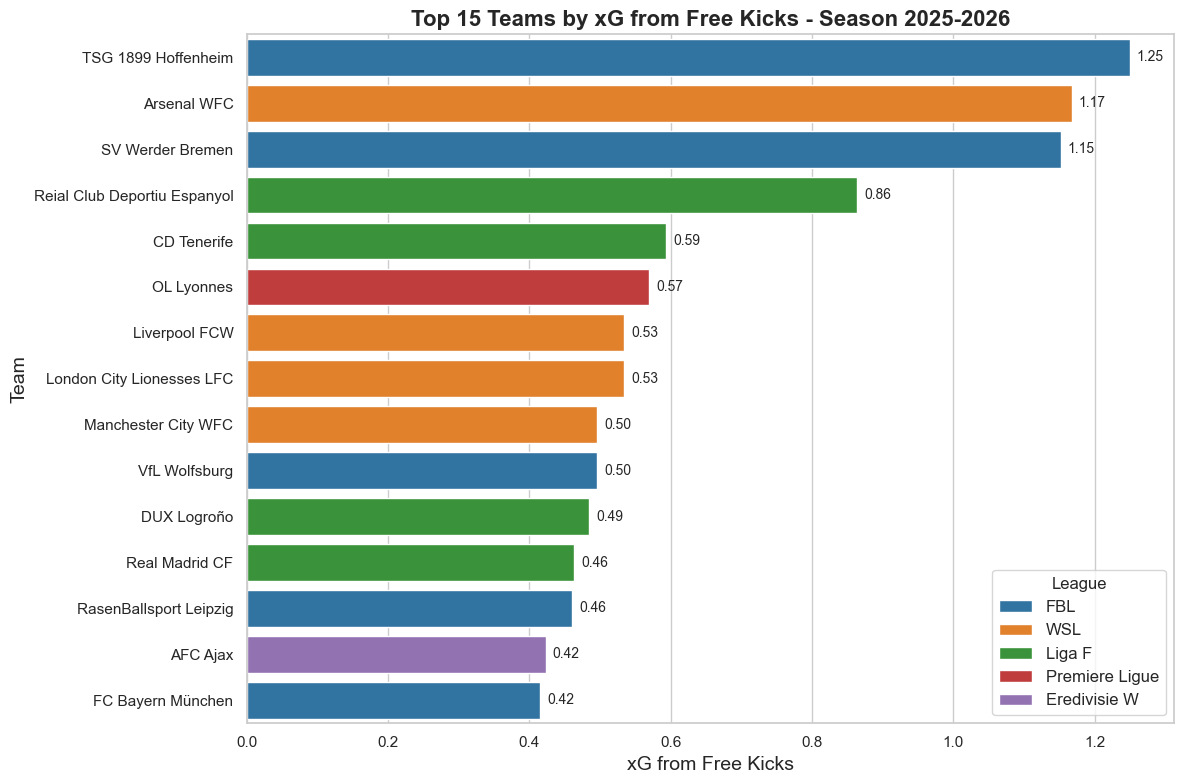
When we look at the total xG generated from Freekicks, we can see that Hoffenheim leads, followed by Arsenal and Werder Bremen.
Throw-ins
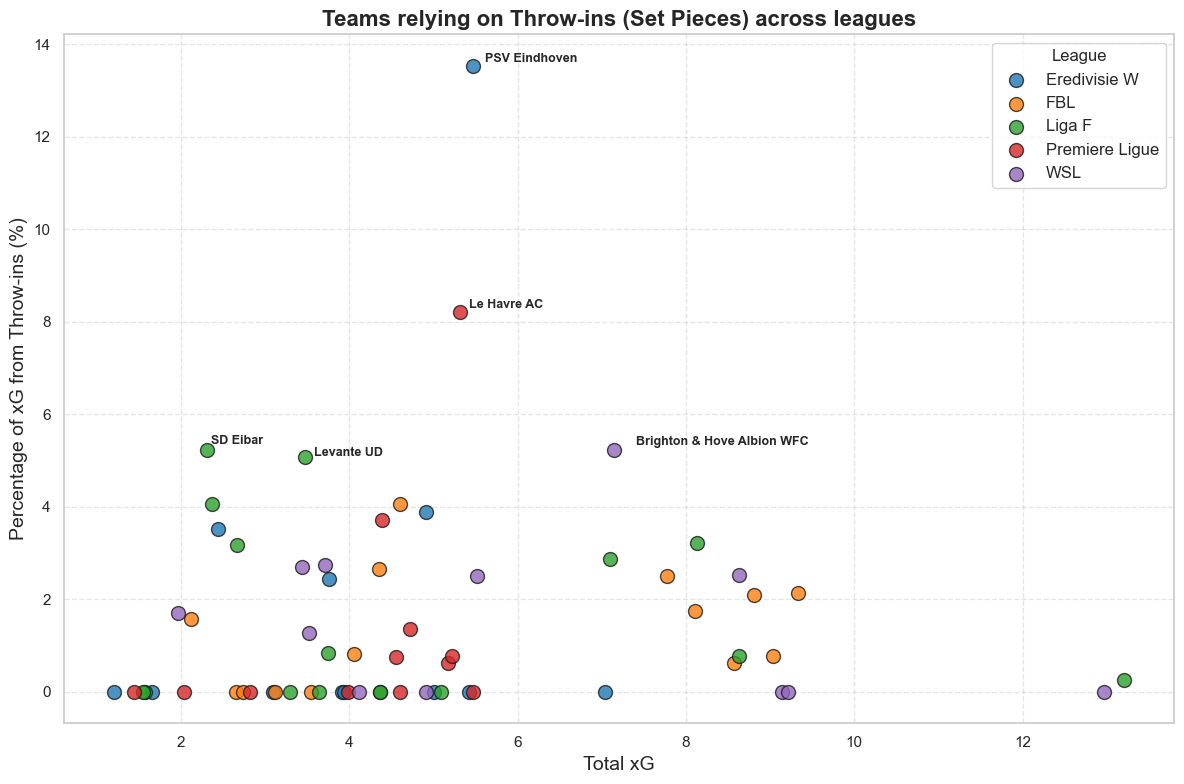
In the scatterplot above you can see the total xG amount of teams in the Eredivisie, Frauen-Bundesliga, Liga F, Premiere Ligue and the WSL. The top performing teams are represented above top 10%, with most teams coming from the Liga F. We look at what percentage of their total xG comes from throw-ins.
What immediately comes to the front is how much of xG PSV collects from throw-ins during the Eredivisie 2025-2026 season so far.
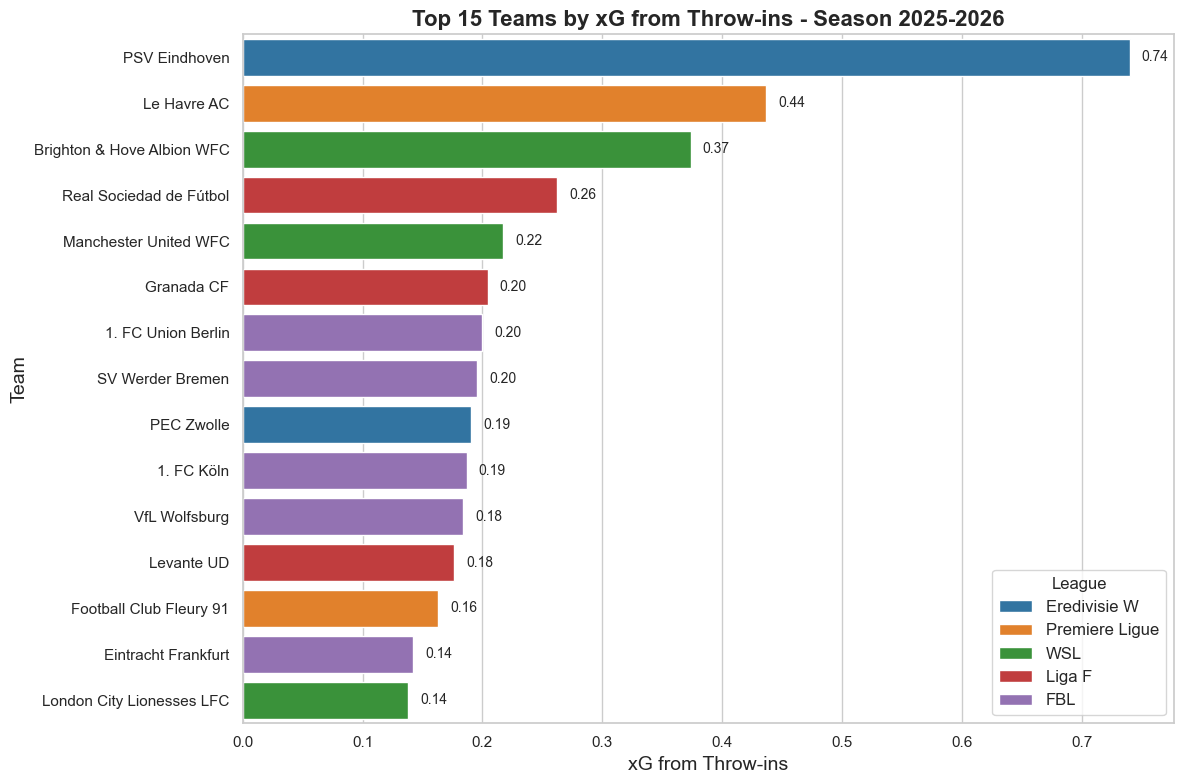
PSV also clearly leads the most xG from throw-ins with 0,74 xG. After that Le Havre, Brighton and Real Sociedad follow. It’s also interesting to see how many clubs from the Frauen-Bundesliga feature in the top 15.
Citation
admin. (2025, oktober 3). Which teams are leading the set piece leaderboards?. Waltzing Analytics. https://waltzinganalytics.com/2025/which-teams-are-leading-the-set-piece-leaderboards/