
Struggles. More often than not, I struggle with what to write on this platform. There are so many interesting things to talk about, but I am always being told that I should focus on a niche more. Well, bugger that. But I do struggle to come up with the right angles for sure.
Writing about data and data analytics will open up a variety of fascinating topics, but I have noticed that the innovations I try to highlight or create focus on what’s good. What’s new and would open up new possibilities? But today I want to talk about the use of data methodology and metrics that are full of risk.
I want to talk about composite scores that are used in data scouting. We will first focus on what composite scores are, then how they are created and what the risk/flaws are when working with composite scores. I will have to say — and I will repeat this at the end — composite scores are not evil. They are not the best for creating scores, but definitely not the worst. A vital piece of information is that you should never use scores, metrics, indexes or models in isolation. Nor should you do that with composite scores.
What are composite scores?
It has been quite a challenge to find a good definition of it, but Statistics Solutions defines it as follows:
“A composite score is a single data point that combines information from multiple variables. In other words, you derive it from multiple pieces of information to create a single score.
[…]
Statistically, the main advantage of this is that it reduces multiple data points into one. A single variable is easier to analyze and interpret than multiple variables. Fewer variables mean you need fewer analyses, which reduces the probability of Type I errors. Composite scoring loses information from individual items, making it harder to account for measurement error in subsequent analyses. However, there are more complex statistical techniques (such as structural equation modeling with latent variables) that can mitigate such issues.”
If we take this definition and explanation and adapt that to sport analytics, football in particular, we can say the following. Composite scores are scores that combine certain metrics together so we have one score in which we can easily compare players with their peers.
Ball Retention Value Model (BRV-Model): Measuring the progression value after a throw-in under…
In football data we are always looking to add value. There are obviously many ways to add value, but I really like to…
Data collection
This article is mainly about statistical and mathematical approaches, but to show you what composite scores can do, I will use some data as well. The data I’m using was collected on June 5th 2025, and is Wyscout data.
The data is aggregated match-level data and focuses on the Latvian Virsliga in Latvia. All players involved have played over 500 minutes and still play in that particular league. The data has been collected via the Wyscout API.
Creating a composite score
My reason for creating a composite score is that I want to judge central defenders against their peers, but also in the role they play. Positions are roles, not always the same, and therefore, I wanted to look more closely at this.
I want to look at which central defenders (LCB, RCB, CB) are the best on the ball. In other words, how good of a ball-playing defender are they? The first thing I then have to do is to choose which metrics are relevant for that:
- Accurate passes, %
- Progressive passes per 90
- Successful dribbles, %
- Passes to the final third per 90
- Progressive runs per 90
- Smart passes per 90
- Assists per 90
A composite score of this would be: the sum of all these metrics and divided by their parts. That doesn’t really distinguish between the roles or the metrics. It says that all metrics are equally important and to really create that role, we can’t allow this notion.
That’s why in composite scores, we also look at weights: how important is a metric compared to the total?
ball_playing_weights = {
    'Accurate passes, %': 0.25,
    'Progressive passes per 90': 0.20,
    'Successful dribbles, %': 0.15,
    'Passes to final third per 90': 0.15,
    'Progressive runs per 90': 0.10,
    'Smart passes per 90': 0.10,
    'Assists per 90': 0.05,
}
In the Python code snippet above, you can see the weights assigned to every metric in the composite scores, as I have assigned them. For me the accurate passes and progressive passes are the most important when creating a weighted composite score.
If I apply this to my database of central defenders in Latvia, I can see that these players are scoring the highest.
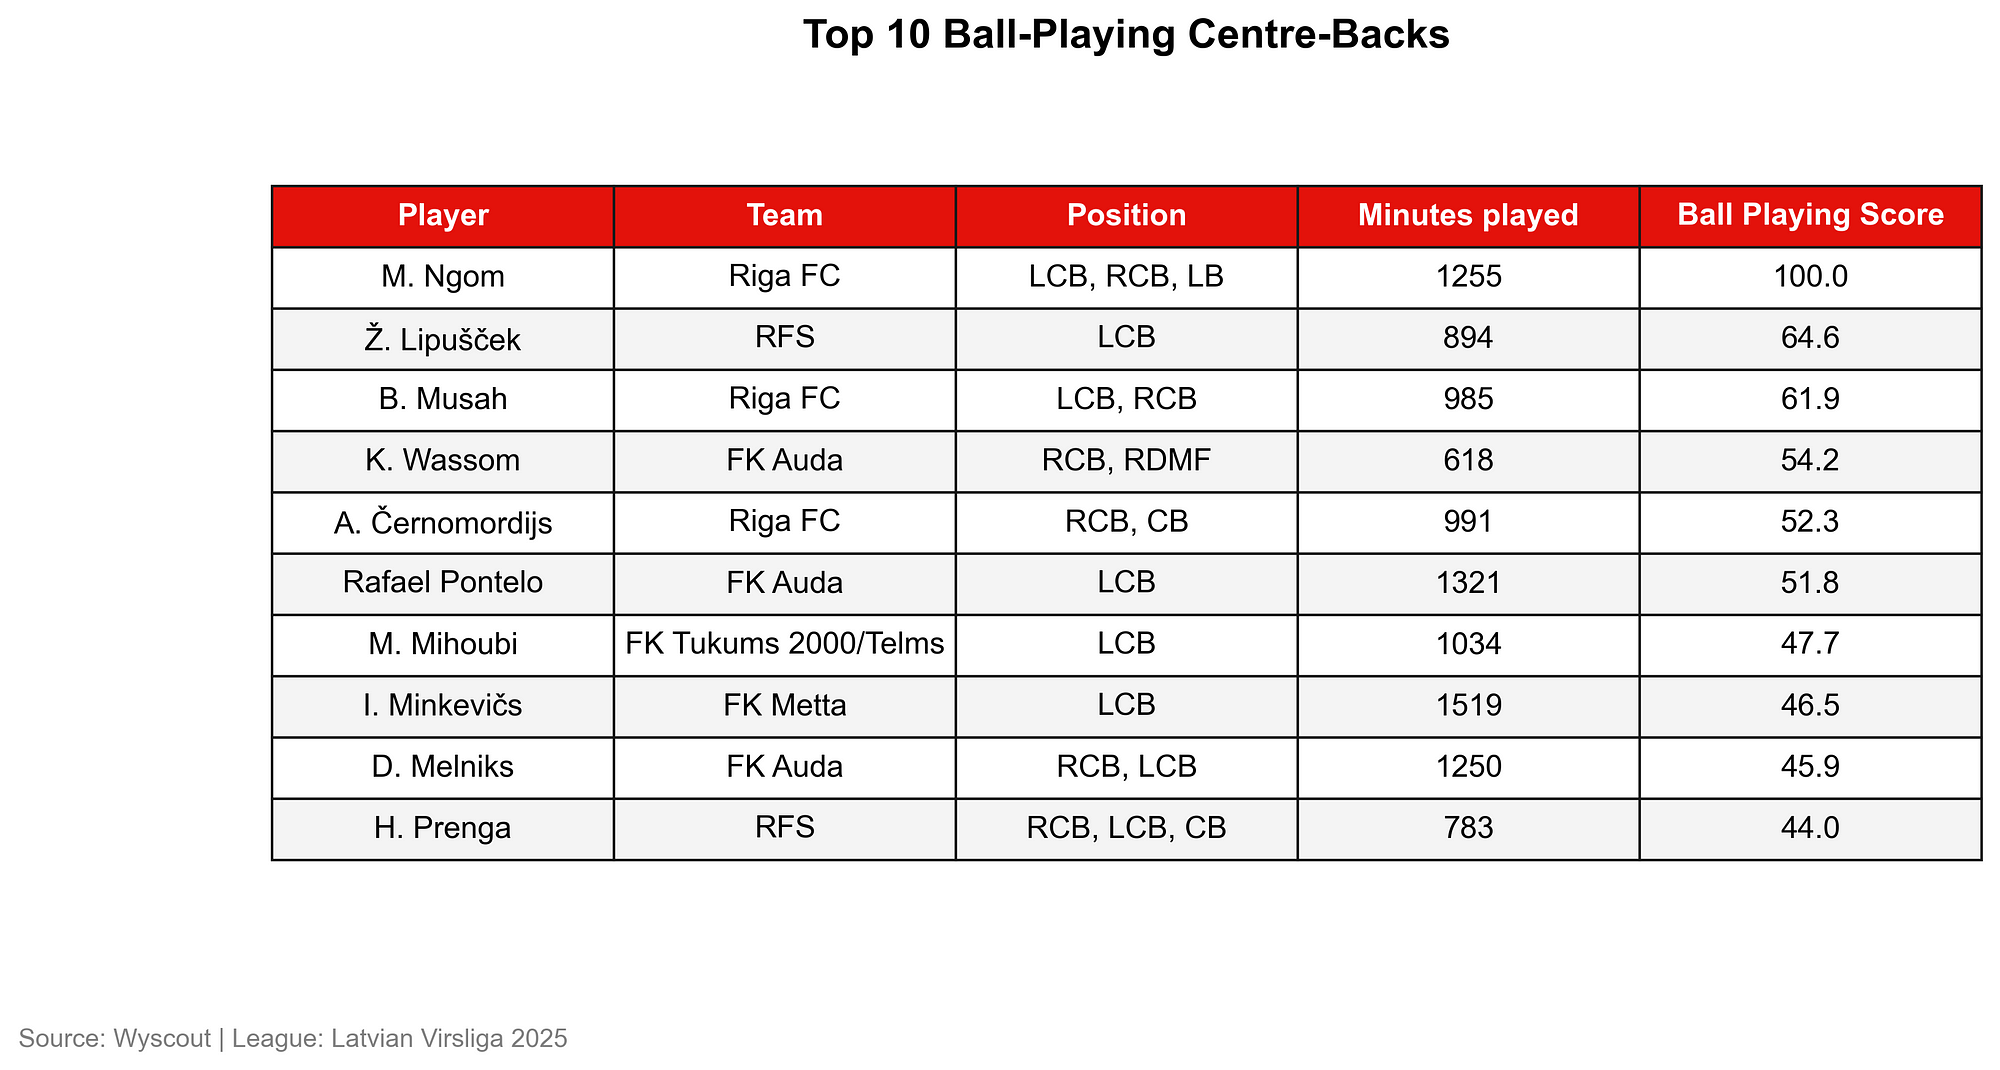
As you can see here, Ngom, Lipuscek and Musah scores highest in the role of centre-backs according to my weighted composite score. Now what happens when we adjust the weight of dribbles? We value dribbles more now and so we want it to make a bigger part of the players’ game.
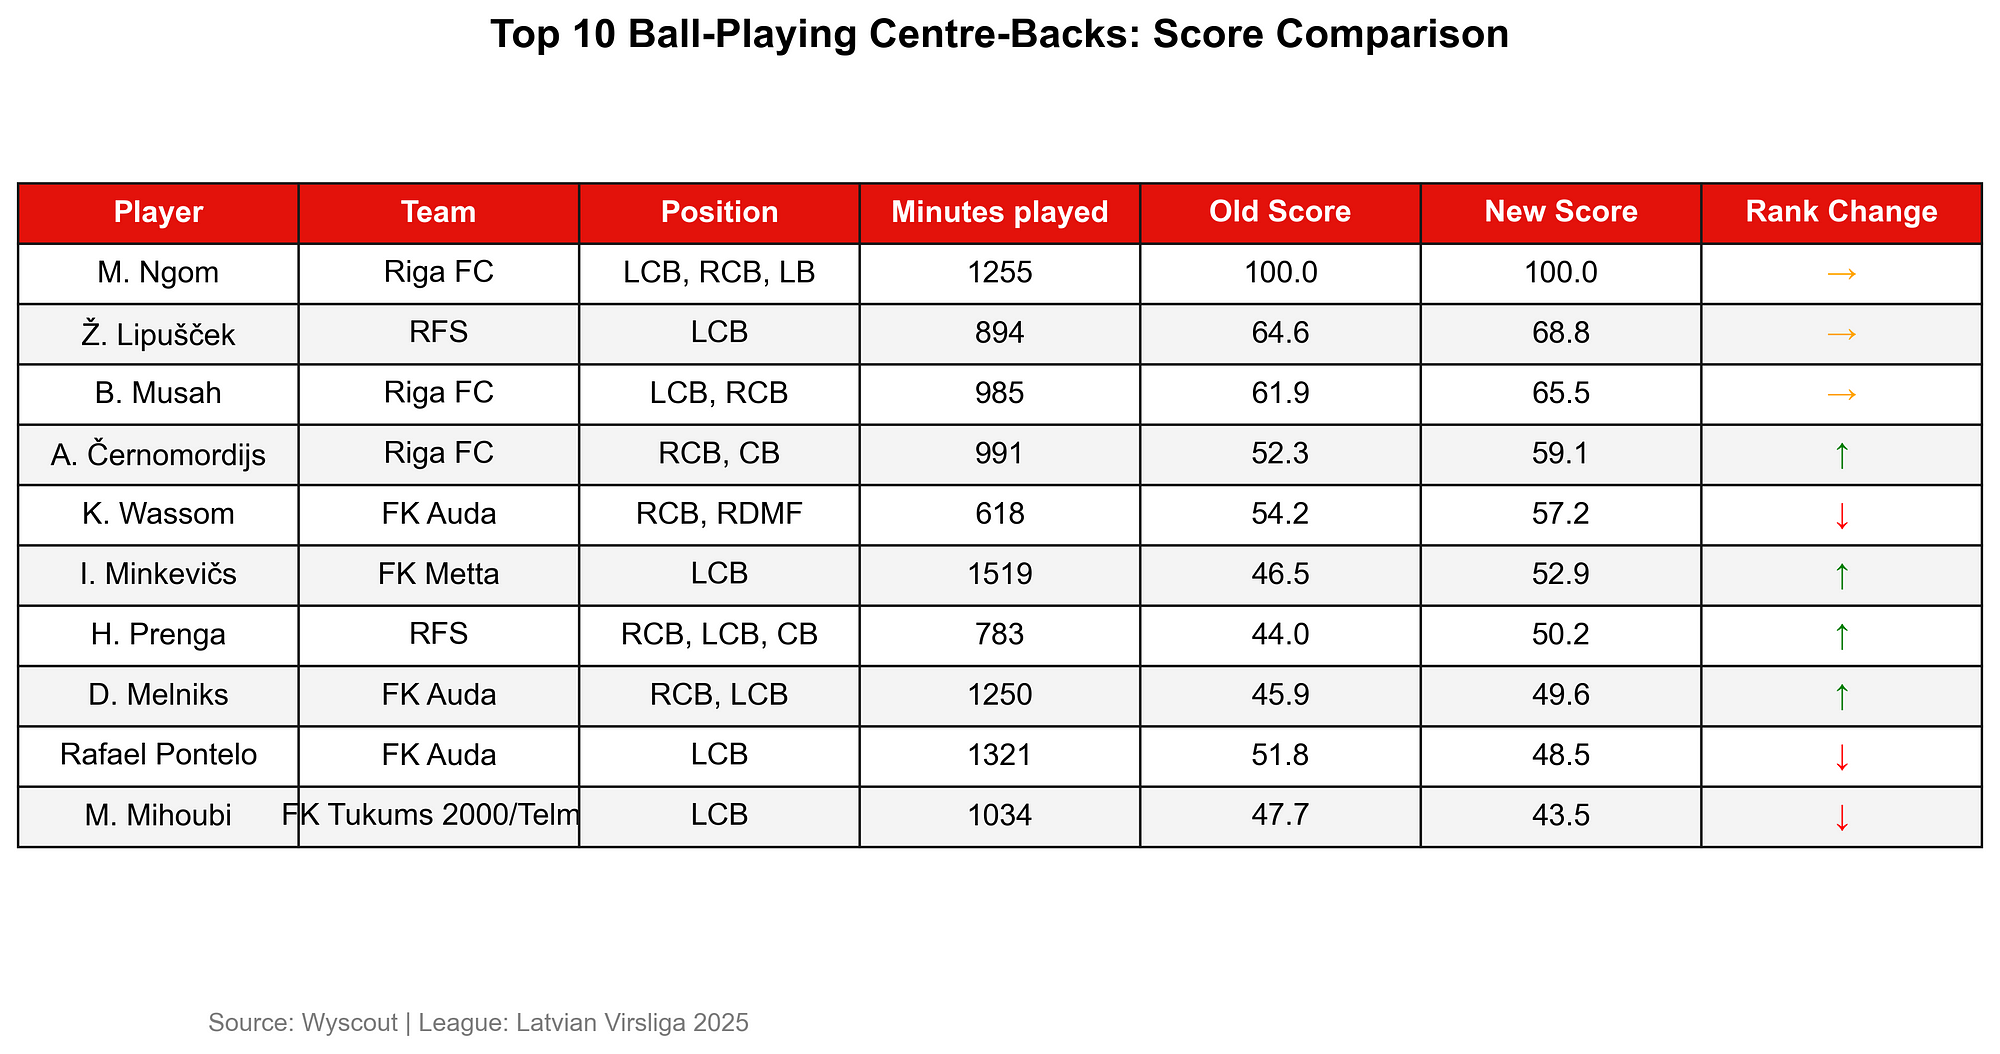
The effect of changing one weight in the composite score can have some effect. In this case, we see that of the 10, only the top performers have remained on their rank. The rest of the players has changed ranks.
Risks of using composite scores
- Loss of granularity occurs when distinct skills, like defending and playmaking, are combined into a single rating. This blending hides the specific strengths and weaknesses of a player. As a result, you can’t tell why a player is rated highly or poorly, only that their overall score is a certain value. It reduces the clarity and usefulness of the evaluation.
- Weighting bias happens when certain stats are given more importance than others, such as positioning or pressing. This skews the evaluation toward flashy metrics and can overlook the impact of less visible but crucial contributions. As a result, role players and defensive anchors may be consistently underrated.
- Over-simplification arises when complex player roles and tactical responsibilities are reduced to a single number. This ignores context like position, team strategy, or individual duties. As a result, comparing players, like a defensive midfielder and a winger, with the same score can be misleading and inaccurate.
- Data quality issues occur when errors, inconsistencies, or missing values in the source data affect the final score. These flaws become part of the model, leading to distorted evaluations. As a result, the output may seem trustworthy but is based on unreliable information, creating false confidence in the assessment.
- Context ignorance happens when key factors like league strength, team tactics, opposition quality, or match state are overlooked—this strips performance data of crucial nuance. As a result, players with similar scores may have delivered those performances under very different conditions, making comparisons misleading.
Introducing the Probability Even Strength Index (PESI): how can we rank expected performances…
I can’t be the only one who feels like this from time to time. I have hit the wall in terms of creating or developing…
Final thoughts
Before you all start waging war with me, I’m not saying that we shouldn’t use composite scores anymore. I still use them myself. I want to make it clear, however, that they are very vulnerable to slight alterations in weights. And, if the weights change, the outcome of a particular composite score can be vastly different.