3.1 / Services / Data Scouting

Data Scouting: Finding Players Statistically

A worked example of the player-scouting analysis behind the Data Scouting tile — three ways of using Eredivisie player data to surface names worth a closer look: a style map built with PCA, an anomaly-detection pass that flags players whose numbers don't fit their peer group, and a contextual scatter for a specific statistical profile. 255 outfield players, 900+ minutes, Opta/StatsPerform event data, Meridian house style.
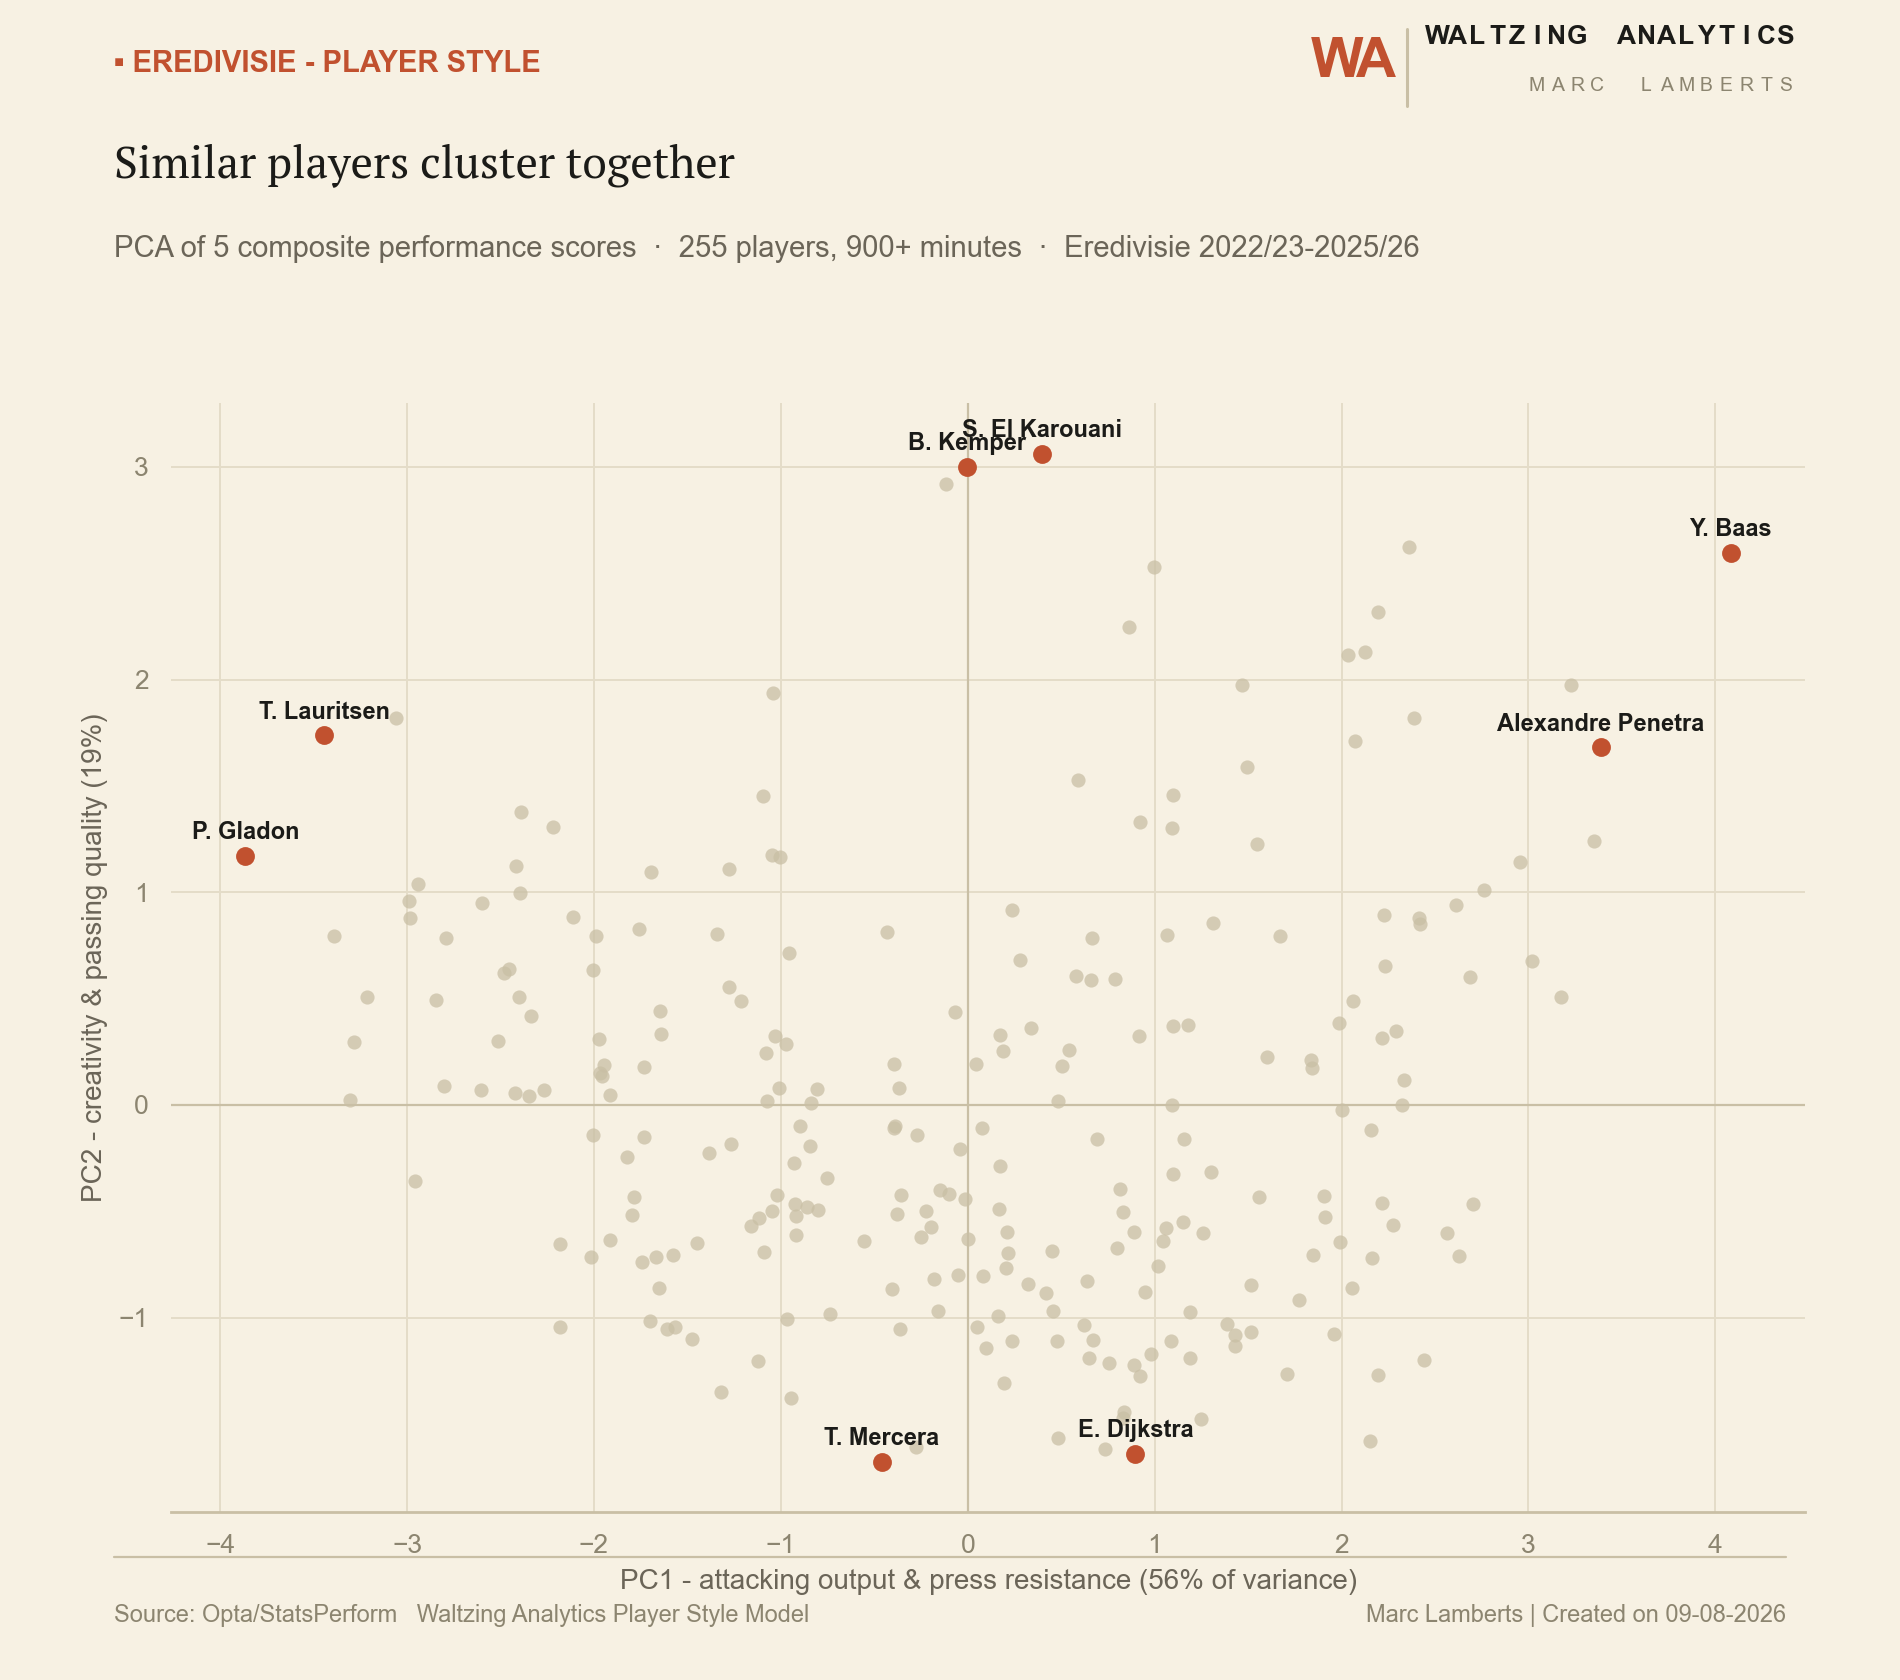
PCA scatter plot of Eredivisie players by playing style, based on 5 composite performance scores
Similar players cluster together — PCA of 5 composite performance scores, reducing attacking output, passing quality, defensive quality, creativity and press resistance to a 2D style map.
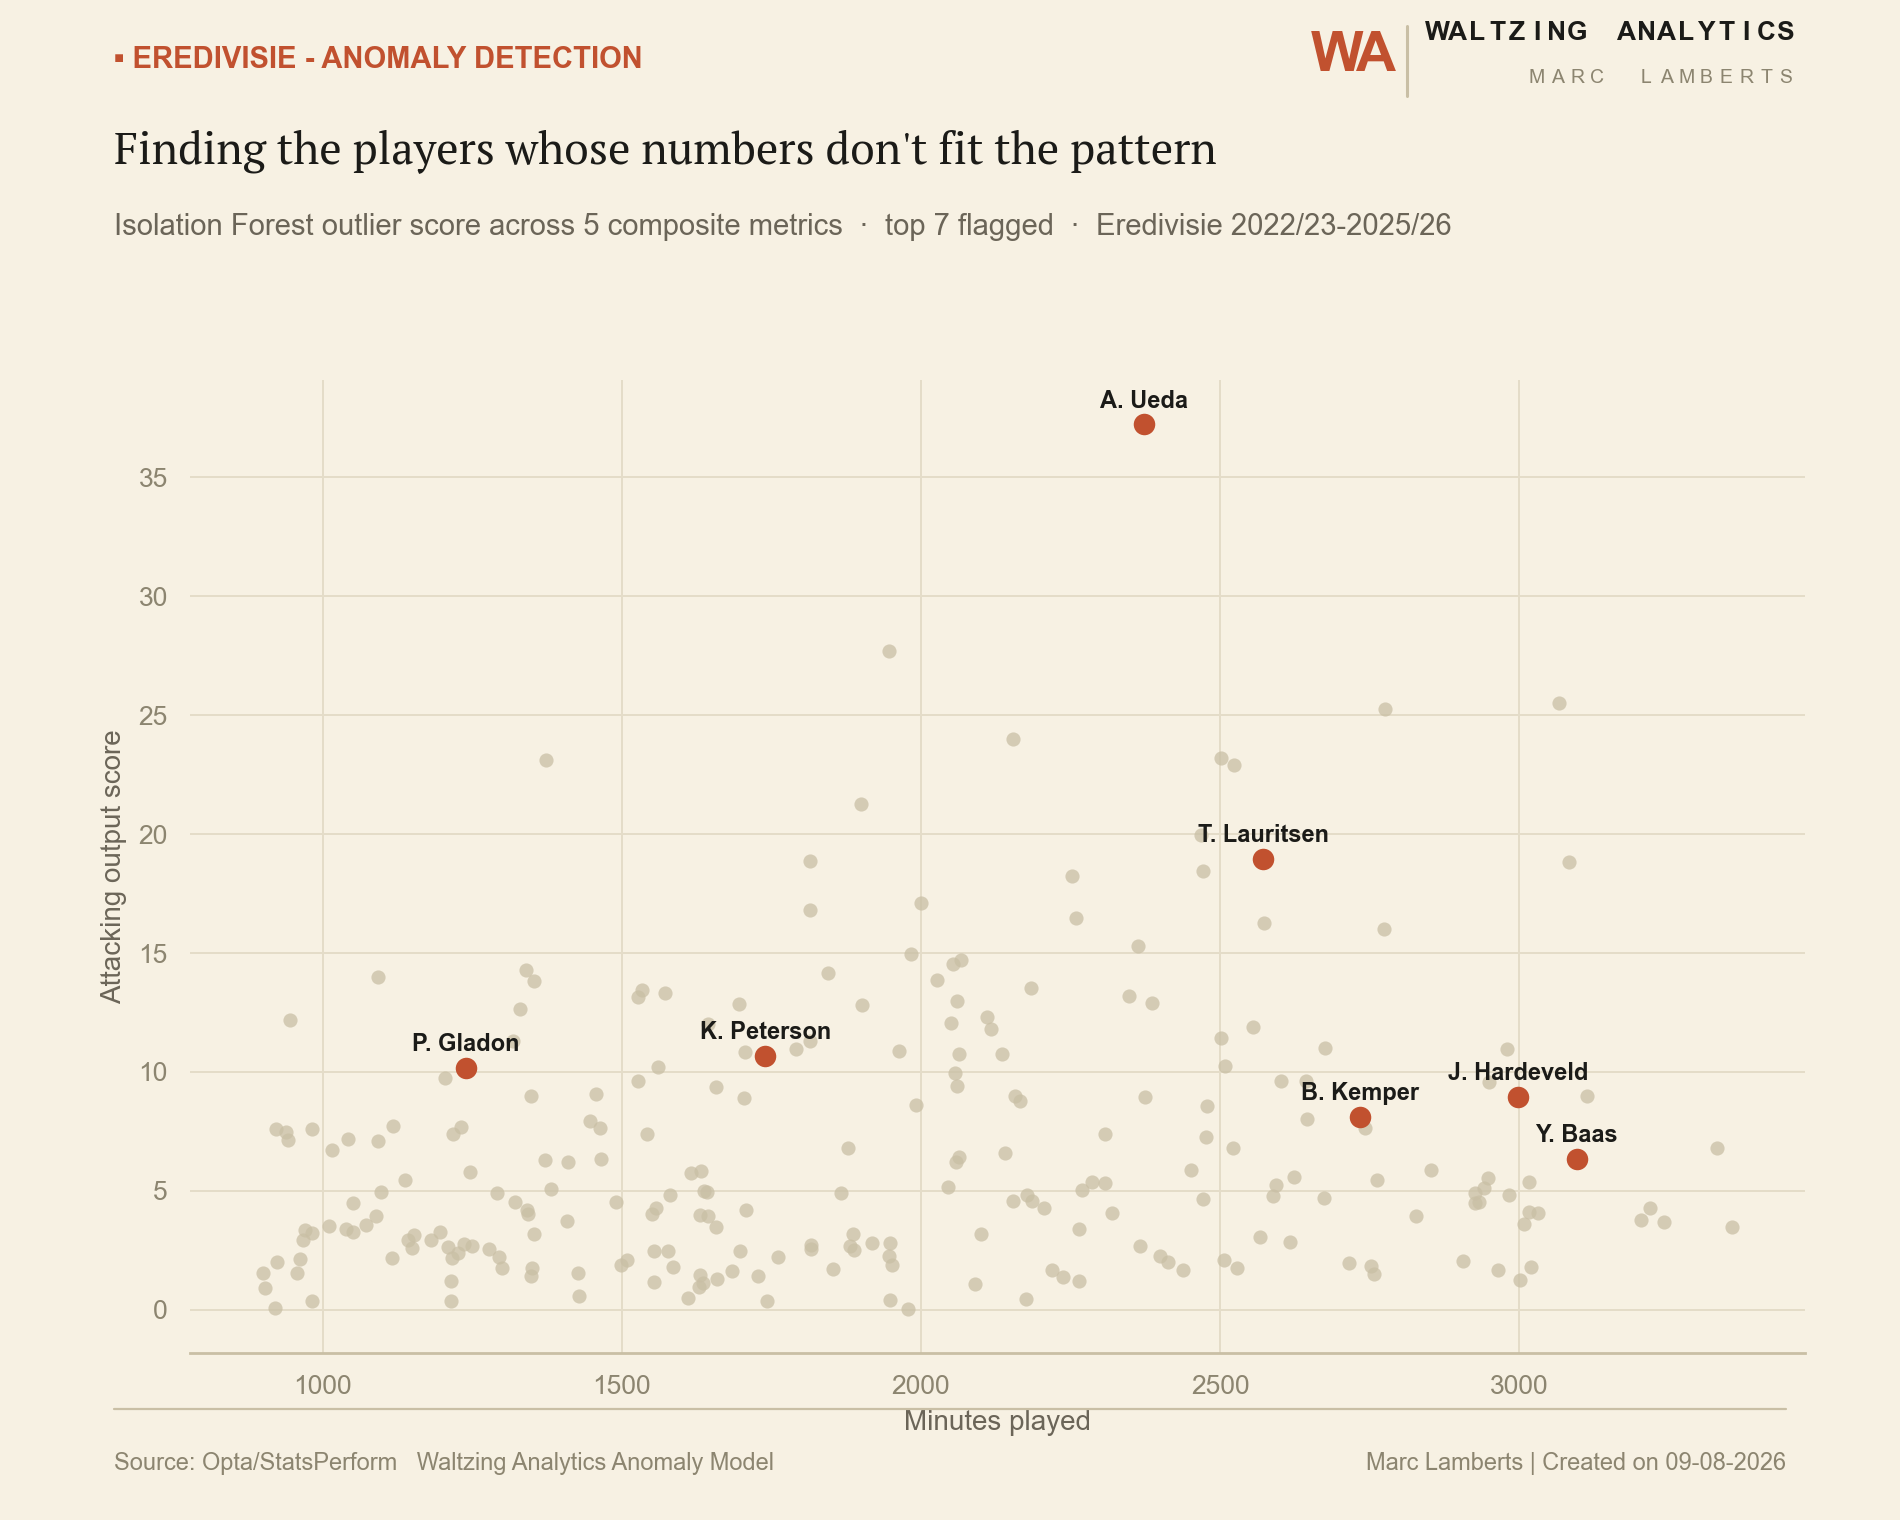
Scatter plot of Eredivisie players' minutes played versus attacking output score, with Isolation Forest anomaly detection flagging statistical outliers
Finding the players whose numbers don't fit the pattern — an Isolation Forest model flags the players whose statistical profile is least like everyone else's.
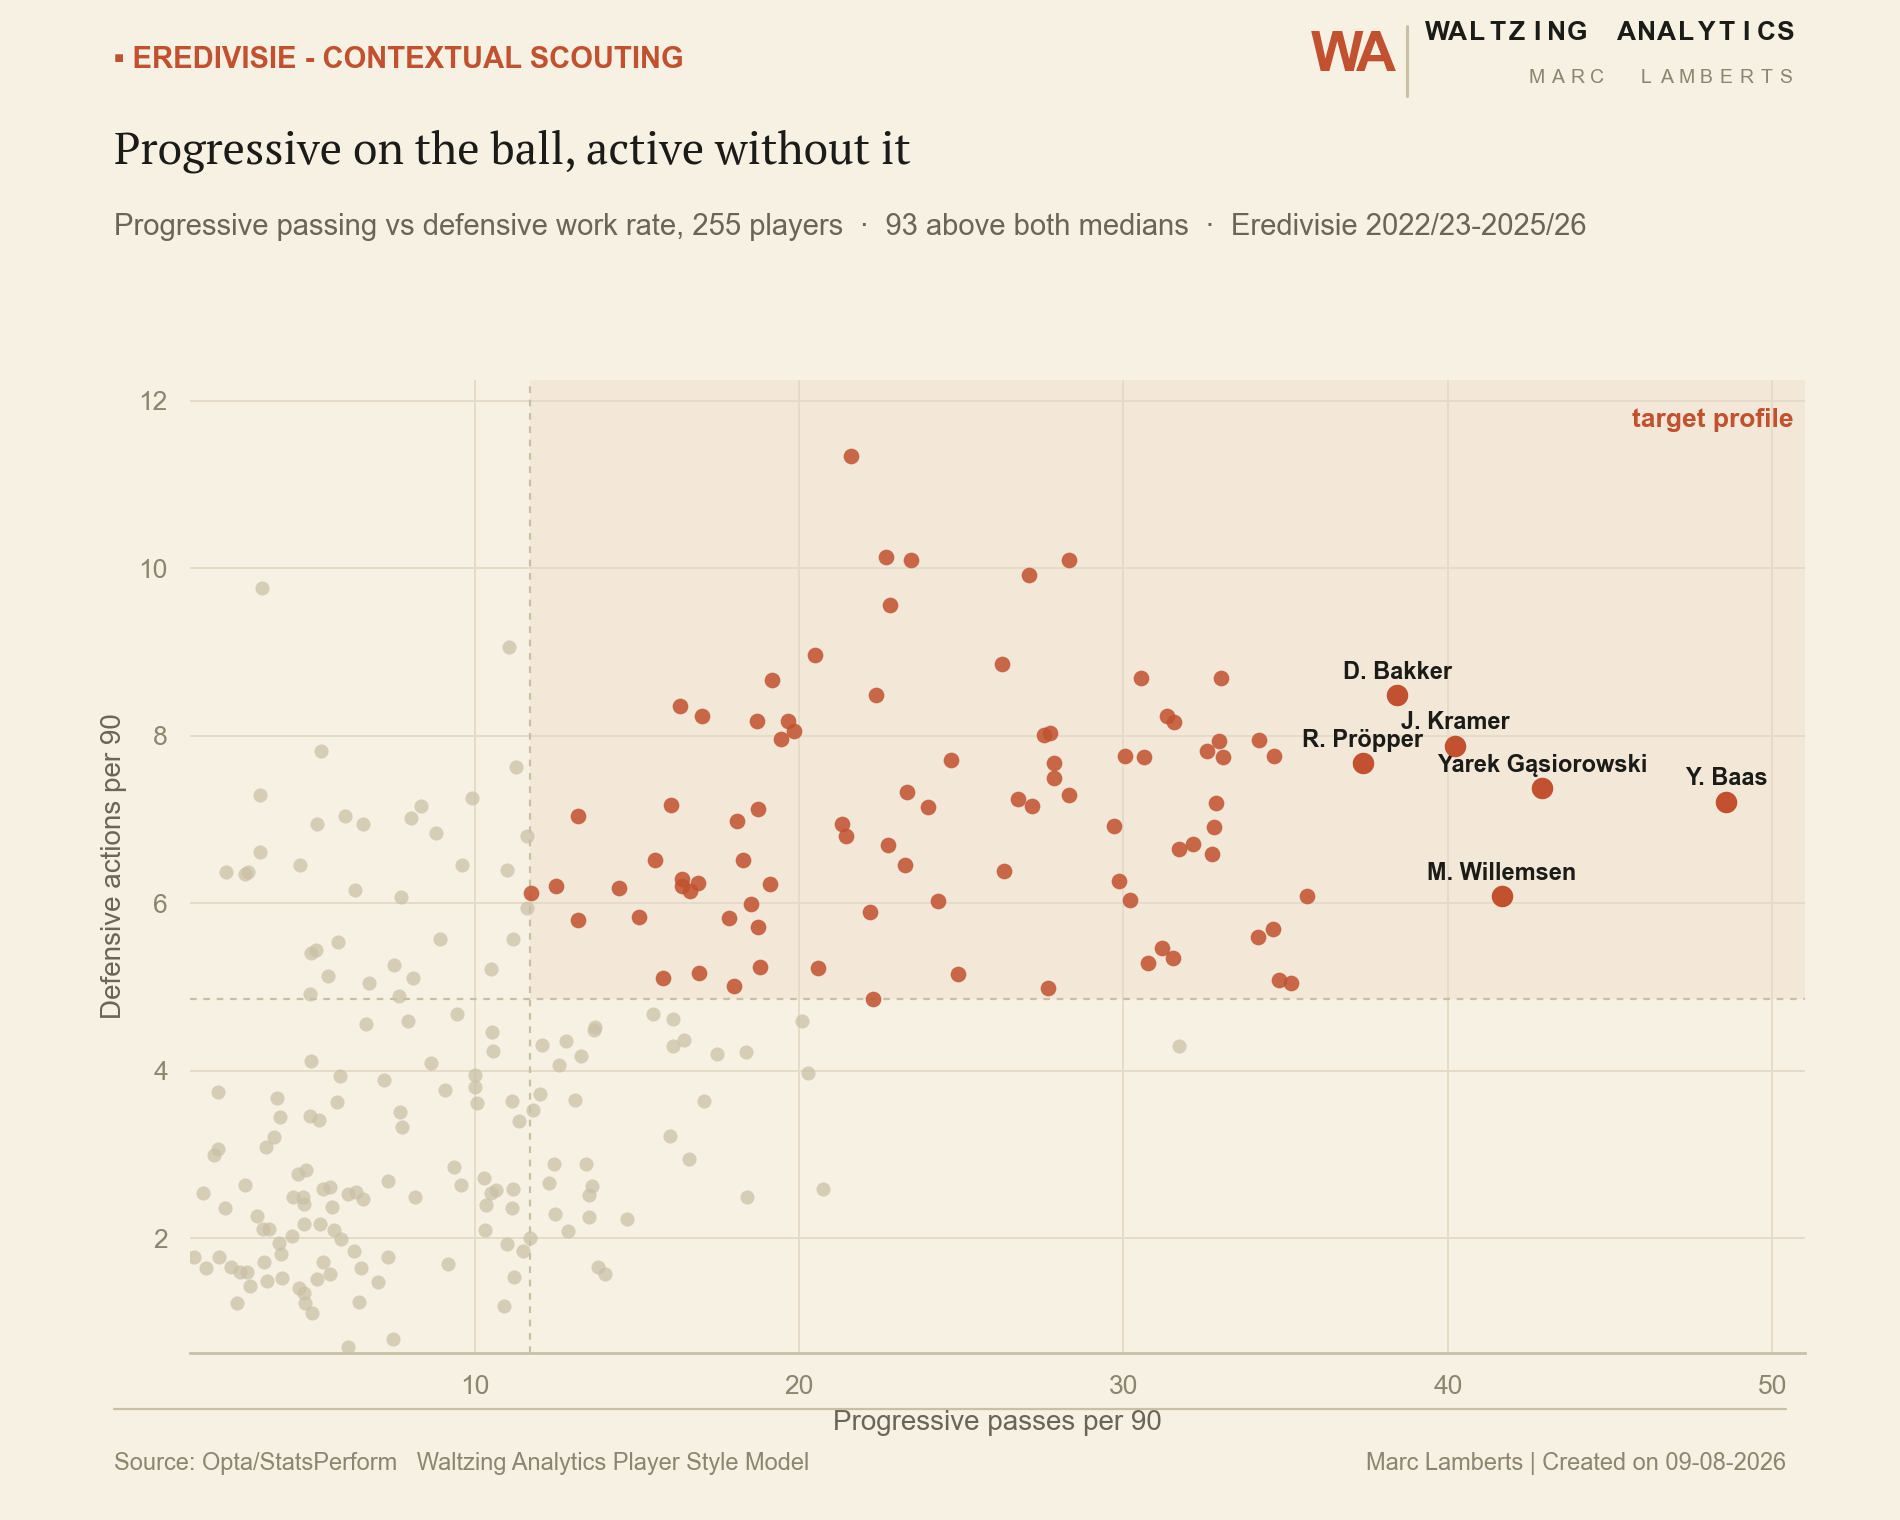
Scatter plot of progressive passes per 90 versus defensive actions per 90 for Eredivisie players, highlighting a target profile quadrant
Progressive on the ball, active without it — a contextual scouting scatter built around a specific profile: progressive passing and defensive work rate together, not traded off against each other.

As a service

Commissioned, this becomes a shortlist or a style map built around your actual brief: a position, a budget band, a specific statistical profile you're chasing, not a generic "best available players" list. You get the ranked names, the visual read on how they cluster or stand apart, and the confidence behind each one, delivered as a report or a dashboard depending on what your recruitment team already works from. Get in touch to scope one against a real vacancy.

← Back to Services