
There was a time when I had the means and energy to write a new article every week, but with the appalling state of the world and genuinely being really busy, this isn’t the case anymore. It does give me time to ponder a few things, and one of these things is Expected Pass.
Expected pass is a weird statistic because it doesn’t signify the expectation of whether the pass is going to happen. It indicates what the likely completion of said pass is and could, in some instances, involve pass difficulty. We can look at different providers, and they all have done things differently.
My aim with this article is to create my own Expected Pass Model, but with a few things added. I would like to create a metric that includes Time-To-Execute. In other words, what does time on the ball have to do with pass completion probability?
Contents
- Why this research?
- Data representation and provider
- Theoretical framework
- Methodology
- Results
- Time-to-execute
- Challenges
- Final thoughts
- Sources
1. Why this research?
The aim of this research is purely for my own purposes, because I want to create an xPass model myself. Different models out there look at expected passes. The model is focused on the probability of a pass being completed. I have looked at the models from Opta and Statsbomb. While they are incredibly useful and have a high degree of quality, I want to build my own. And I have three reasons for it:
- I want to build my own model, so I will have total control of how the features and variables are being used.
- I want to add time-to-execute: how quickly the ball is being passed, and what kind of effect it has on the expected probability
Whether I’m going to be successful or not depends on how I execute it correctly. I also think we need to be vigilant that data is always biased and that we can do innovative research, but it doesn’t mean that something useful comes out of it.
2. Data representation
I know these articles follow the same structure over and over again, but this might be one of the most important sections of our research. We need to understand that every data provider takes different actions in how they capture the data, what definitions they use, and how they make models and metrics. In being aware of this particular stuff, we can make higher-quality research with our own models.
I have the option to choose from different sources: Opta, Statsbomb, Wyscout and IMPECT. Because Opta is most accessible for most people who read this, I’ve chosen Opta. I am dealing with raw event data (X,Y) that focuses on on-ball actions rather than off-ball actions.
The data can be split in two databases. The first database is to train the model. I have selected 6 seasons of the Belgian Pro League from 2019–2020 until 2024–2025. These are in and around 1500 games we use to train the data. The next database is the current 2025–2026 season of the Belgian Pro League. I want to calculate the xPass numbers for the 2025–2026 using the model trained on all the other seasons.
The data was collected on March, 31st 2026, via the Opta API. The data was stored as JSON, which is now my preferred output to work with, but you can easily work with CSV/Excel files as well.
3. Theoretical framework
The model draws on four theories from statistics and mathematics. These underpin the calculations that follow, rather than forming part of them directly.
The first is the Bernoulli event framework. At its core, a pass is a binary event; it either succeeds or it doesn’t. In practice, this means every pass is assigned a value of 1 (completed) or 0 (incomplete), treating each one as a discrete decision with exactly two possible outcomes. The likelihood of success is governed by an underlying probability, though this is not fixed. It shifts depending on the contextual conditions surrounding each pass.

xPass represents the probability that any given pass will succeed, based on the conditions surrounding it. This grounds the metric in classical probability theory, the outcome is uncertain, but that uncertainty is structured by what we can observe. Framing pass completion this way gives the model a theoretically sound foundation, one that captures the inherent unpredictability of the action while still producing something meaningful and comparable across different types of passes.
The second theory is conditional modelling. The core idea here is straightforward: not all passes are created equal, and the likelihood of completing one depends heavily on the circumstances in which it is attempted. Rather than treating every pass the same, the model assumes that a set of contextual variables shapes the probability of success and that understanding those variables is key to understanding the outcome.
In this context, xPass is defined as the probability of a pass being completed given what we know about it at the moment it is played. The emphasis is on conditioning, isolating how individual factors influence the outcome while accounting for everything else. This makes it possible to compare passes that vary in difficulty and context in a meaningful way, effectively standardising performance across situations that would otherwise be hard to evaluate on the same terms.
The third theory is the statistical learning framework. This addresses a more fundamental question: how does the model actually learn the relationship between context and outcome? The honest answer is that the true mechanism is unknown. What the model does instead is approximate it, drawing on large samples of historical passes to identify patterns that associate particular combinations of features with higher or lower completion rates.
In practice, this means fitting a function that takes a set of input variables and returns a probability. Logistic regression is a natural fit here, given that the outcome is binary and the results are relatively easy to interpret. Regularisation is typically applied as well, acting as a check against overfitting, ensuring the model picks up on genuine patterns rather than quirks in the training data. The end result is an empirical estimate of how context and success relate to one another.
The fourth and final theory is the framework of generalisation. Training a model is only half the challenge; the other half is determining whether what it has learned actually holds up on new data. This framework asks whether the relationships identified during training remain valid when the model is applied to passes it has never seen before. The underlying assumption is that they do: that the connection between pass characteristics and outcomes is stable enough to transfer across different samples and situations.
In practice, xPass values assigned to new passes are treated as probability estimates grounded in historical evidence. How reliable those estimates are depends largely on how well the training data reflects the conditions the model will encounter going forward. If the game changes, tactically, personnel-wise, or even in how the data is collected, the model’s accuracy may deteriorate. This is why validation and out-of-sample testing are not optional extras but core parts of the framework.
4. Methodology
The modelling process begins with extracting pass data from match JSON files. Each file is parsed to identify pass events, in Opta’s data structure, a pass is recorded as typeId 1, with x and y coordinates capturing where on the pitch it took place. For each pass, a range of attributes are collected: the player and team involved, the match context, spatial coordinates, timing, and whether the pass was completed. The raw data is then cleaned, removing incomplete or invalid entries and organising what remains into a consistent tabular format.
From there, feature engineering transforms the raw event data into variables that are meaningful for the purposes of the model. Spatial features are derived from the start and end coordinates of each pass, capturing distance, direction, and how far the ball progresses up the pitch. Additional contextual variables are constructed to reflect tactical conditions — whether a pass is forward, long, or played late in the match, for instance. Categorical identifiers such as team and player are encoded numerically where possible, though using player names directly will produce non-numerical values. Missing data is addressed through a combination of imputation and indicator variables that flag absence rather than simply discarding it.
The dataset is then split into training and testing subsets to keep the evaluation clean. A logistic regression model with regularisation is fitted on the training data, learning how pass characteristics relate to completion outcomes. Once trained, the model generates probability estimates for both the training set and new, unseen passes — and it is these estimates that form the basis of the xPass metric.
Each pass is represented by a collection of features that are combined into a single score reflecting how favourable the conditions are. That score is converted into a value between zero and one, representing the estimated probability of completion. This is the xPass value.
Training the model involves optimising a loss function that measures how well predicted probabilities match observed outcomes. Log loss is used here, penalising confident predictions that turn out to be wrong most heavily. A regularisation component is included to limit the size of model coefficients, reducing the risk that the model latches onto noise in the training data rather than genuine patterns.
At the individual pass level, xPass gives an estimate of how likely each action was to succeed. These probabilities are then aggregated to produce player-level metrics. Summing probabilities across all of a player’s attempts gives expected completed passes, while actual completed passes come from the observed data. The gap between the two is a measure of performance relative to expectation. Supplementary metrics, average pass probability and overall completion rate, provide further context when evaluating players.
Model performance is assessed using a combination of probabilistic and ranking-based measures. Log loss evaluates how accurate the predicted probabilities are. The Brier score captures the average squared difference between predictions and outcomes. The area under the ROC curve tests how well the model separates successful passes from unsuccessful ones. Taken together, these metrics give a thorough picture of how reliable and accurate the model is.
5. Results
The model was trained on a dataset of 204,699 passes drawn from 224 matches, covering 16 teams and 446 unique players of whom 374 were retained after low-frequency players were grouped. The data was divided using a match-based split, producing a training set of 163,859 passes and a test set of 40,840. The overall pass completion rate across the full dataset was approximately 77.9%, with near-identical figures in both the training (78.0%) and test (77.5%) samples, suggesting the split is consistent, and neither subset is meaningfully skewed.
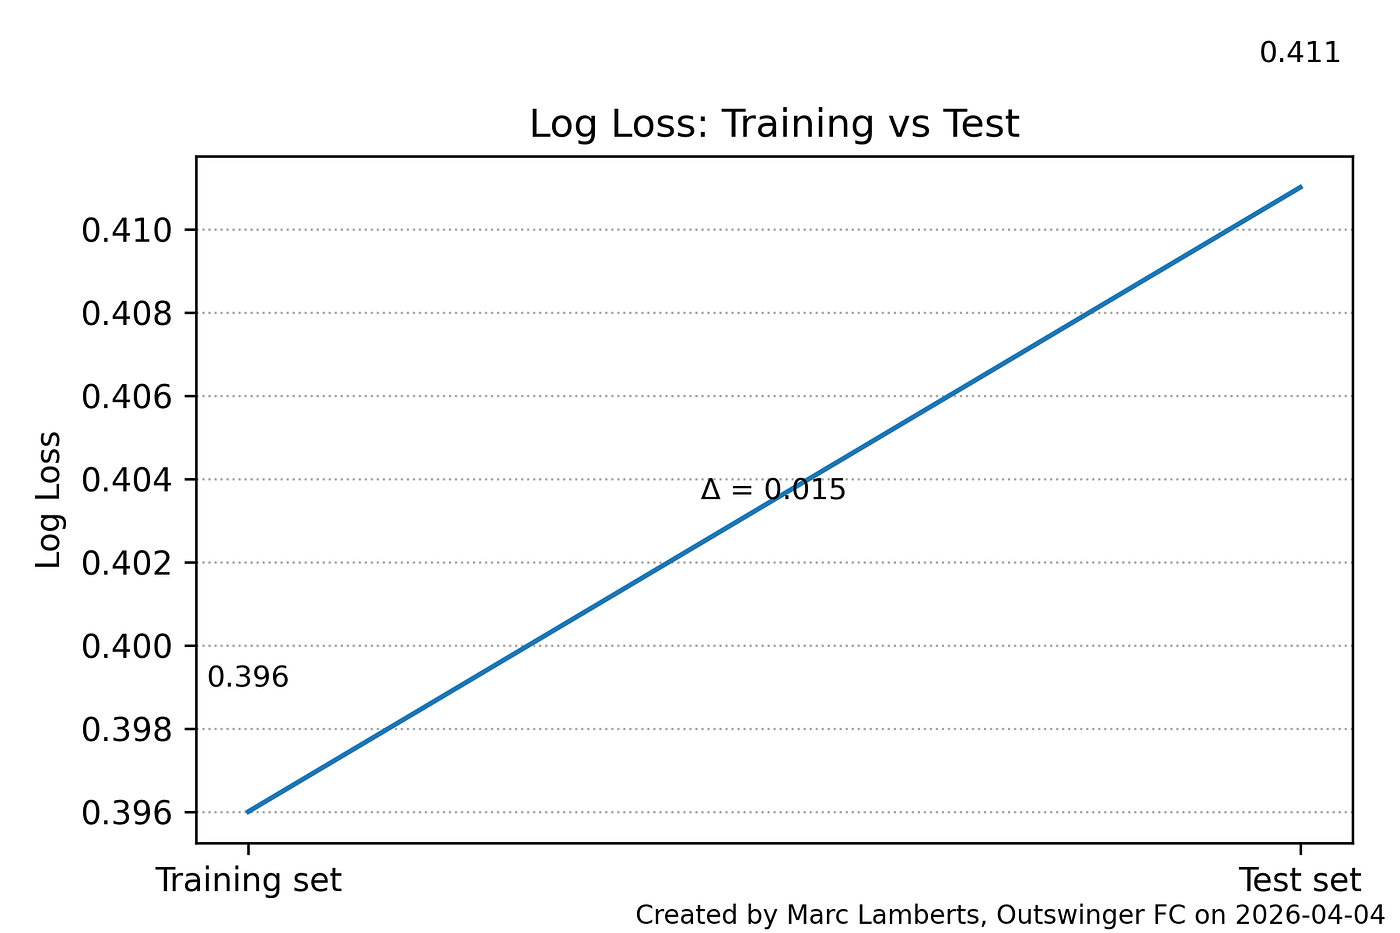
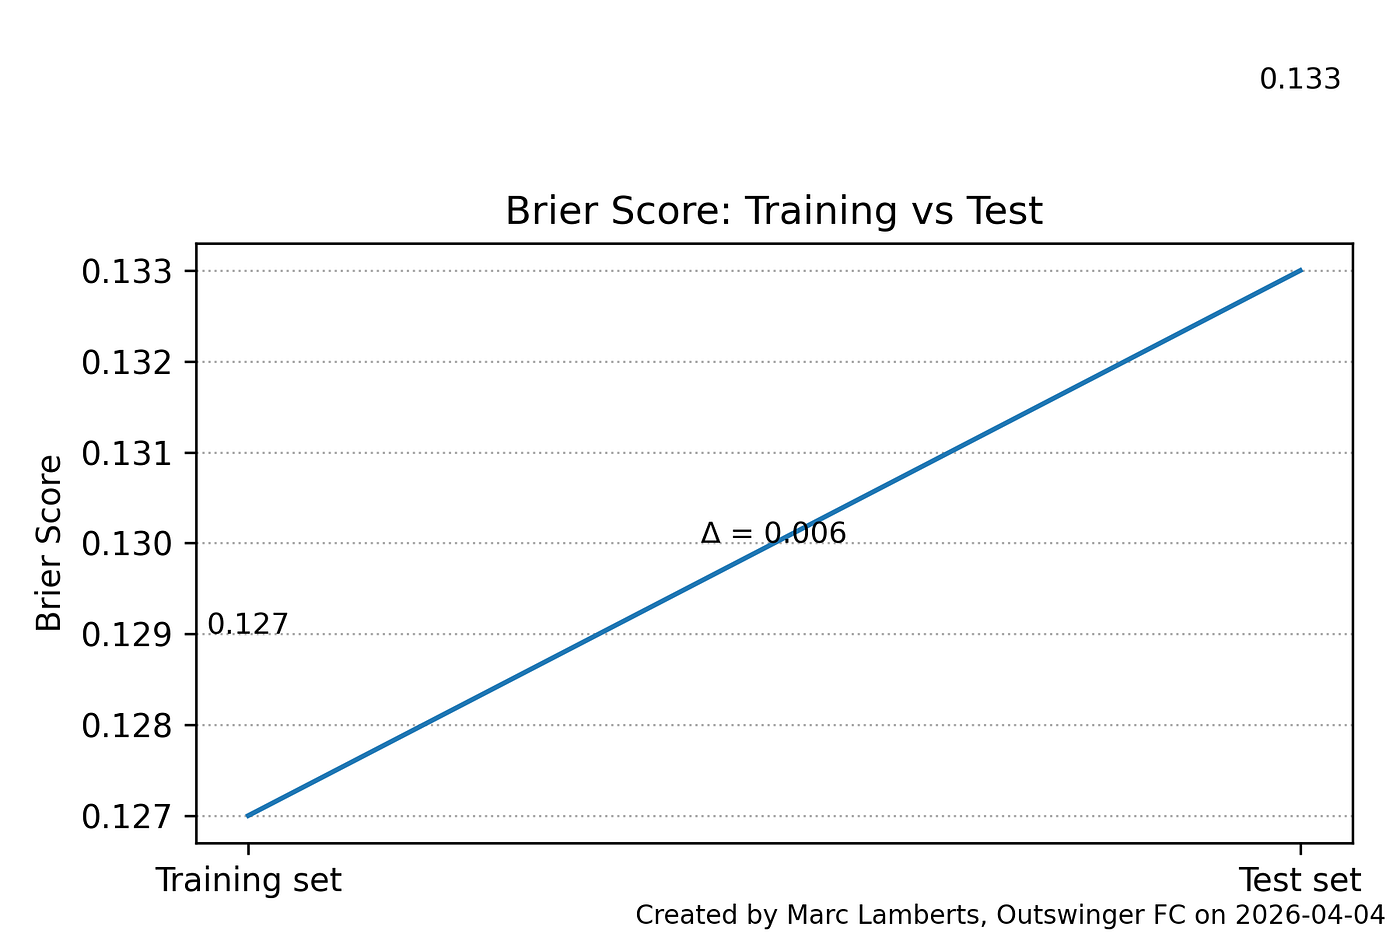
In terms of probabilistic accuracy, the model performs well. On the training set, it achieves a log loss of 0.396 and a Brier score of 0.127, both pointing to well-calibrated probability estimates. These figures hold up on the test set, where log loss rises modestly to 0.411 and the Brier score to 0.133. The limited deterioration between training and test performance is encouraging; it suggests the model is not simply memorising the training data, but has learned patterns that carry over to unseen passes.
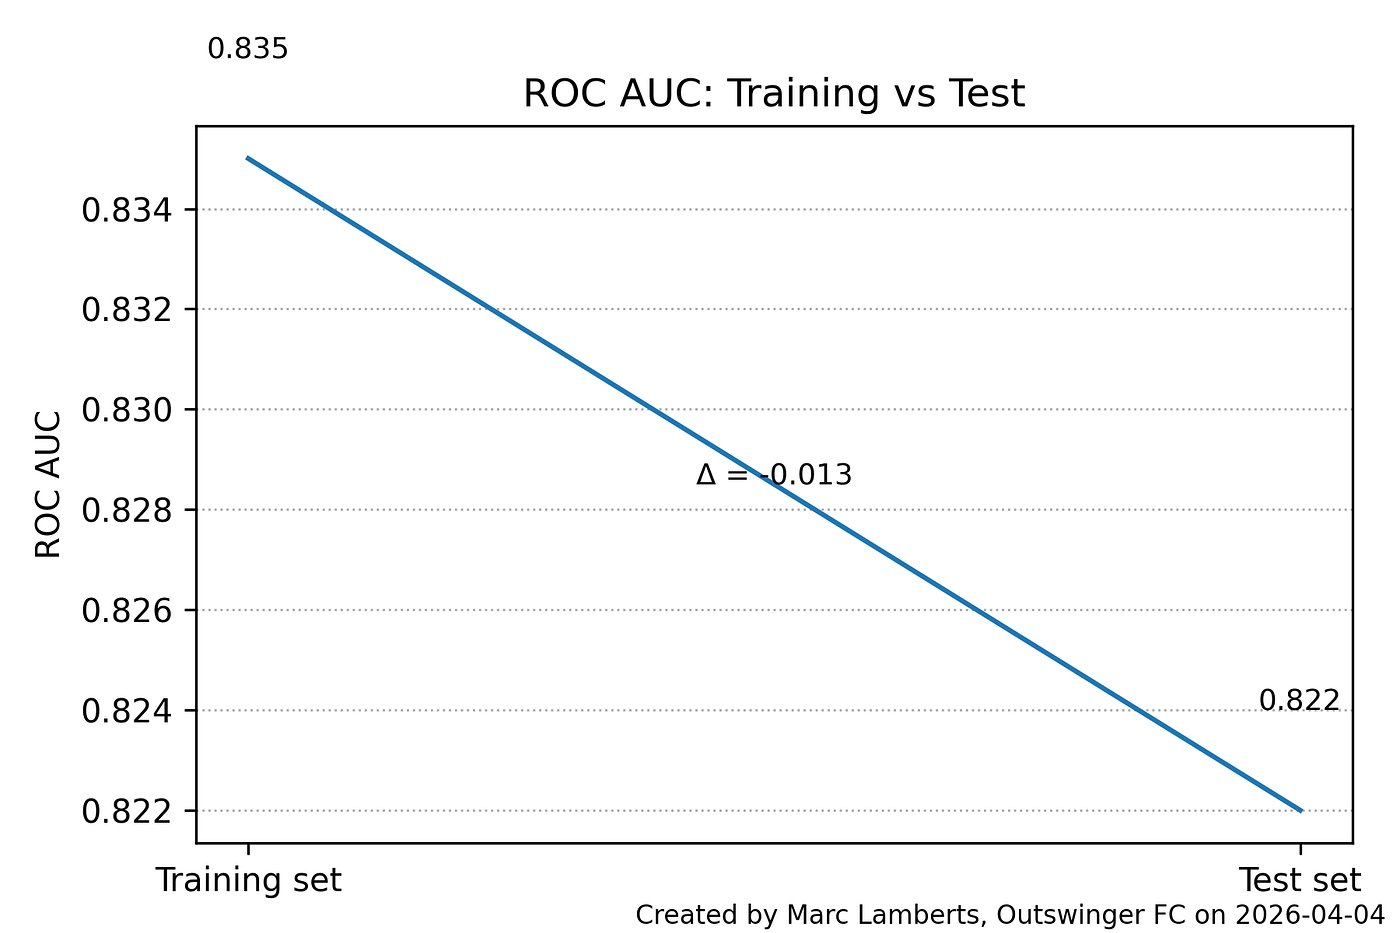
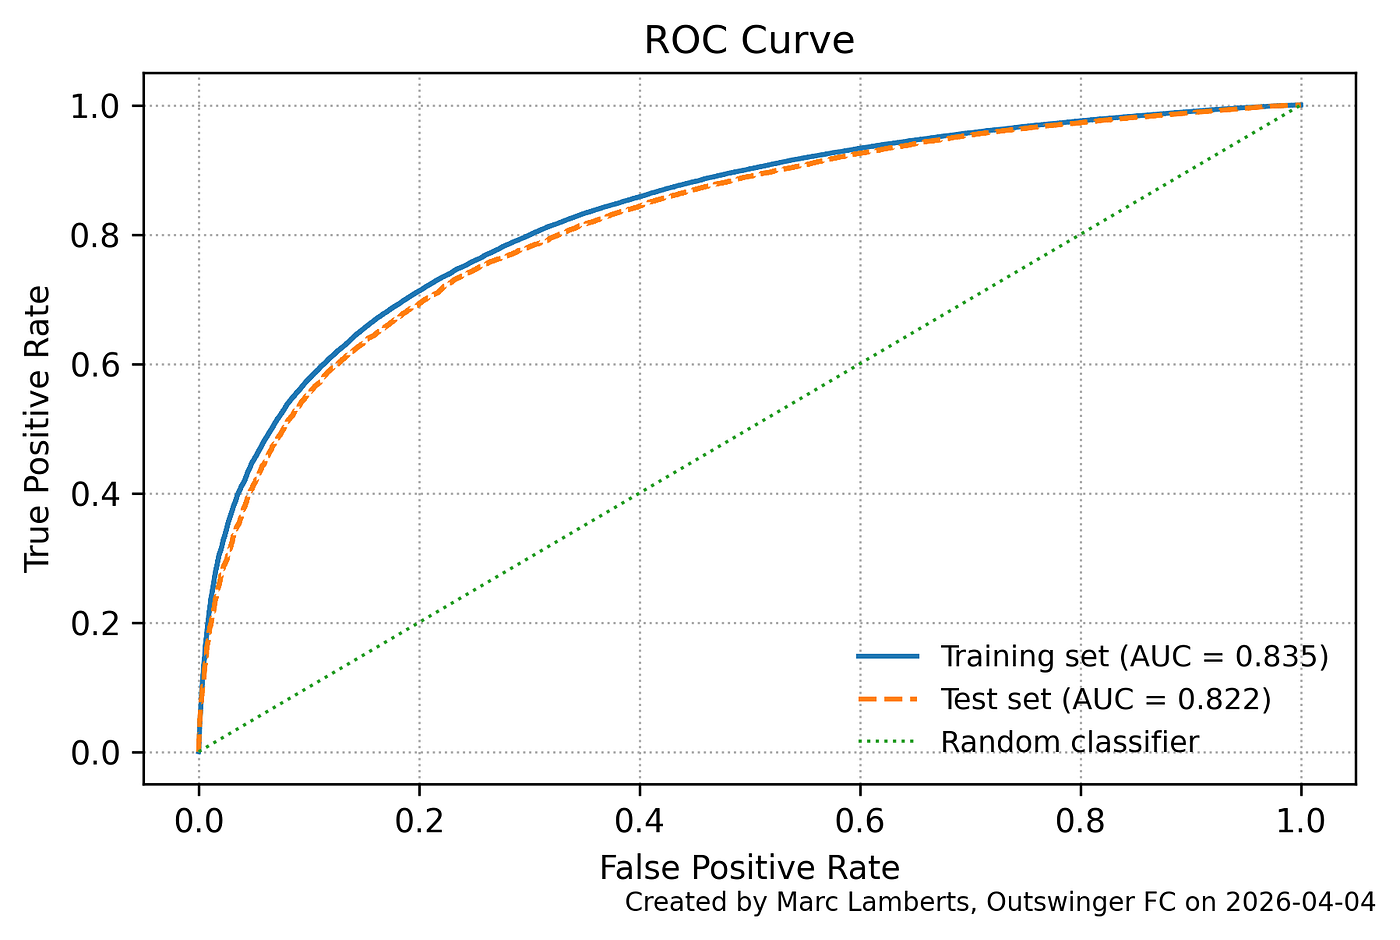
The model is also effective at ranking pass outcomes. ROC AUC comes in at 0.835 on the training set and 0.822 on the test set, reflecting a strong capacity to distinguish between passes that succeed and those that do not. That these figures hold without access to tracking data or information about defensive pressure makes them particularly noteworthy — the model is extracting a meaningful signal about pass difficulty from contextual features alone.
At the pass level, the model’s predictions align with what we would intuitively expect. Low-risk passes; short, backward, or lateral, receive high xPass values, while longer and more progressive passes are assigned lower probabilities. This confirms that the model is picking up on the spatial and directional elements that drive passing difficulty in a way that makes footballing sense.
At the player level, aggregating xPass values across all attempts reveals variation in both volume and performance relative to expectation. High-involvement players naturally accumulate large expected completion totals, while the gap between actual and expected completions identifies those who are outperforming or underperforming their context. Equally telling is the variation in average xPass values across players. Those attempting more progressive or ambitious passes tend to operate at lower baseline probabilities, while players in deeper or less pressured roles show higher averages. This reflects genuine differences in passing profiles rather than differences in quality alone, which is precisely what the metric is designed to capture.
6. Adding time-to-execute
Having established the baseline xPass model, the next step is to introduce an innovation: time-to-execute.
The baseline model, as outlined above, was trained on 204,699 passes across 224 matches, with a pass completion rate of 77.9% that held consistently across both the training and test splits. The time-aware model uses the same dataset and the same split, but expands the feature space by adding temporal variables that capture the time elapsed since previous events, measured at the match, team, and player level. This allows the model to account for how quickly decisions are made and how possession tempo varies, layering a new dimension of context on top of the spatial characteristics already in use.
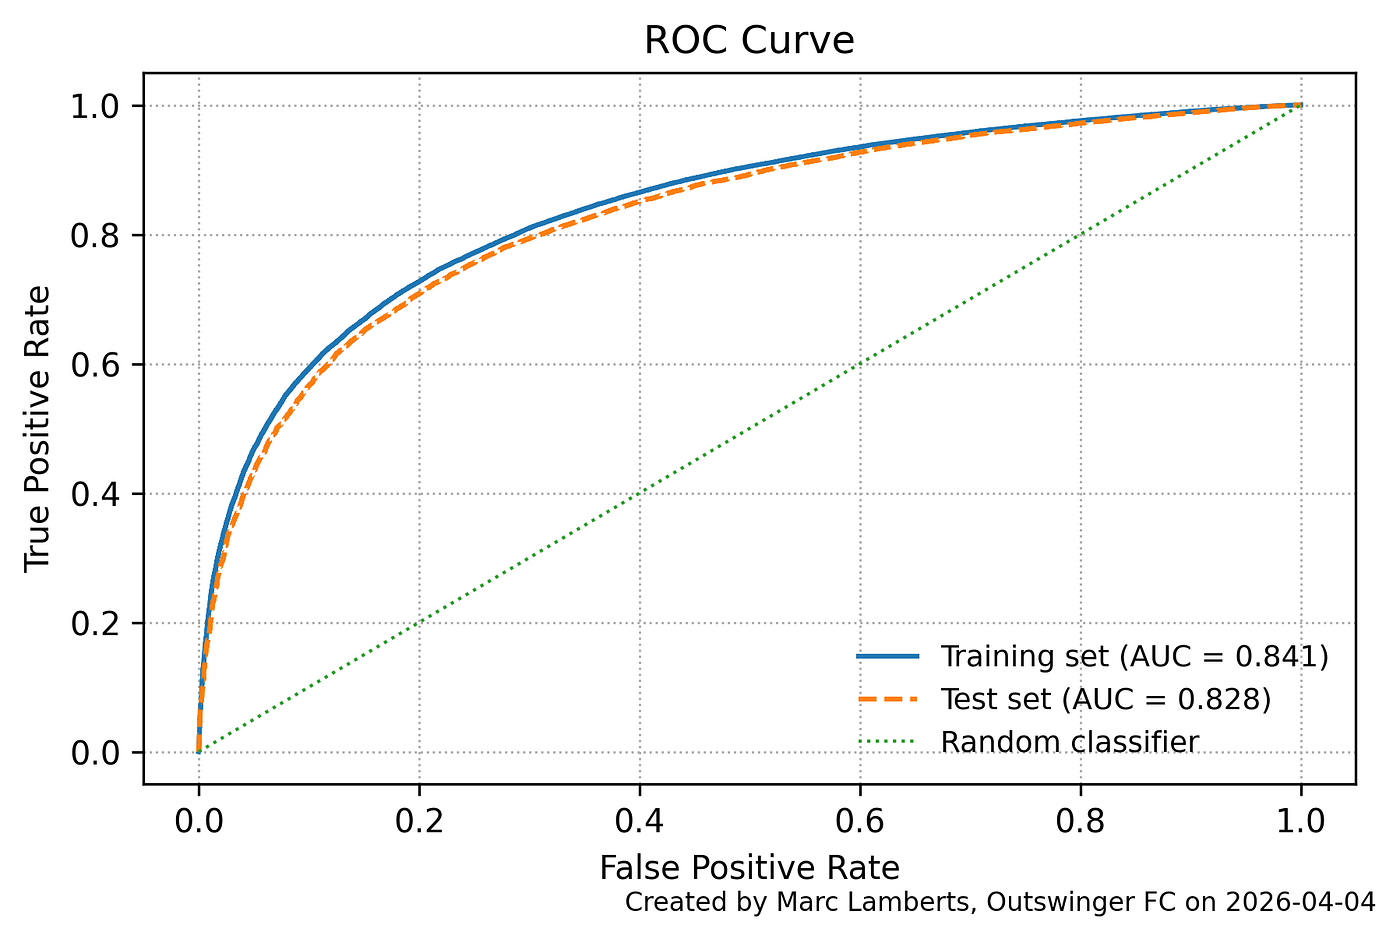
On the test set, the baseline model recorded a log loss of 0.411, a Brier score of 0.133, and an ROC AUC of 0.822. The time-aware model improves on each of these: log loss falls to 0.406, the Brier score to 0.131, and AUC rises to 0.828. The margins are modest — a reduction of 0.005 in log loss, 0.002 in Brier score, and a gain of 0.006 in AUC, but they are consistent across all three metrics, which matters. Taken together, they suggest that adding temporal features contributes a genuine predictive signal, improving both the calibration of the model’s probabilities and its ability to distinguish between successful and unsuccessful passes, without any sign of overfitting in the process.
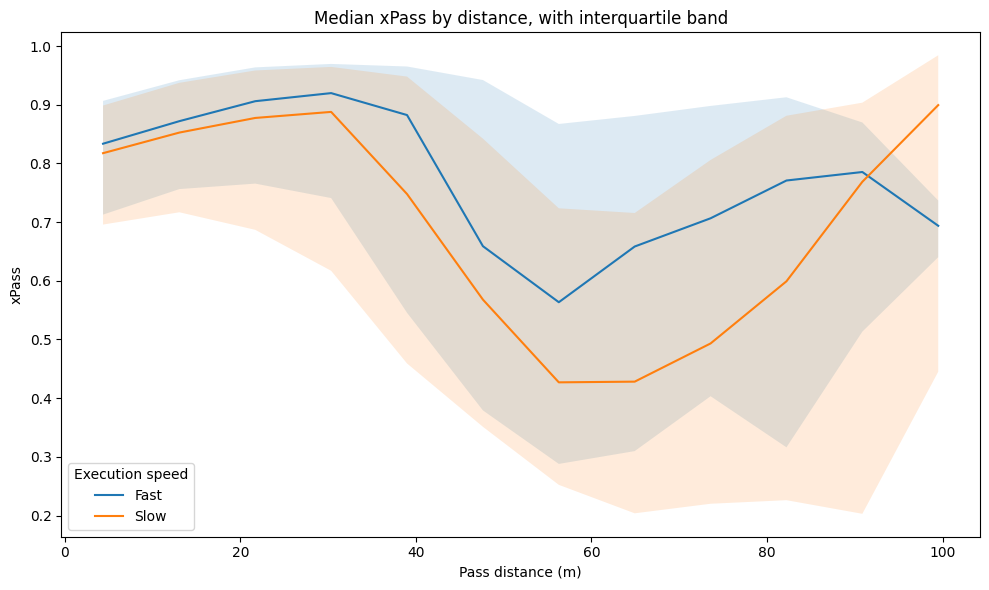
At the pass level, both models produce probability estimates that make intuitive sense, assigning higher values to shorter and less progressive passes. The meaningful difference lies in how each model contextualises those passes. The baseline model evaluates difficulty purely through spatial and static features, while the time-aware model also accounts for how quickly a pass is played. A pass executed shortly after the previous team action, typically under greater pressure, receives a lower probability than a spatially identical pass played after a longer interval. That distinction is invisible to the baseline model.
At the player level, both models surface variation in passing volume and performance relative to expectation, but the time-aware model shifts the interpretation somewhat. Where the baseline primarily reflects spatial passing tendencies, the time-aware version also captures differences in tempo and the decision-making environment players operate in. Those involved in faster, high-pressure sequences tend to show slightly lower average xPass values than the baseline would suggest, while players who operate in slower, more controlled buildup phases appear with higher baseline probabilities. The result is a richer and more realistic picture of passing behaviour — one that combines where passes are played with the speed and pressure under which they are attempted.
7. Challenges
One of the model’s central limitations is that temporal features serve as proxies for decision-making under pressure rather than direct measurements of it. Variables like time since the previous event carry a useful signal, but they do not capture how long a player actually takes between receiving the ball and playing the pass. They may also reflect unrelated events in the data, introducing noise and limiting how faithfully they represent the pressure a player is operating under.
A related challenge is the absence of any defensive context. Because the model relies entirely on event data, it has no information about where opponents are positioned, how much pressure is being applied, or which passing lanes are available. Pass difficulty is therefore inferred indirectly from spatial and temporal patterns rather than observed directly, which means the model is on shakier ground when trying to explain outcomes in heavily contested situations.
The choice of logistic regression also brings structural constraints. The model assumes a linear relationship between features and the log-odds of pass success, which may not hold where variables interact in more complex ways, the combined effect of distance, angle, and tempo being one example. Feature engineering helps to an extent, but the underlying model remains limited in its ability to capture the non-linear dynamics that characterise football actions.
Player identity features introduce a further risk. Grouping low-frequency players reduces the danger of overfitting, but the model may still pick up on player-specific tendencies that do not generalise well. This can quietly erode both interpretability and the model’s usefulness when applied to players it has not encountered before.
Finally, the precision of event timestamps is not guaranteed. Timestamps are often recorded at a coarse level and may not perfectly reflect the true sequence of actions on the pitch. Since the time-based features depend on accurate ordering, even small inconsistencies in the data can introduce systematic errors into how the model represents the flow of the game.
9. Final thoughts
Time-to-execute fills a gap that conventional xPass models leave open. Where existing approaches evaluate passing difficulty through space, distance, direction, and field position, they say nothing about the speed at which a decision is made. This work demonstrates that temporal context carries a genuine predictive signal: the time-aware model improves consistently across log loss, Brier score, and ROC AUC on unseen data, and does so without overfitting. More importantly, those improvements make footballing sense. A pass played under immediate pressure is harder than a spatially identical pass played after a longer interval, and the model now reflects that.
What time-to-execute cannot do is equally important to state clearly. It is a proxy derived from event timestamps, not a direct observation of pressure or decision-making speed. It captures when something happened relative to surrounding events, not why a player chose to act at that moment or what defensive conditions forced his hand. The absence of tracking data means the model remains blind to positioning, pressing intensity, and passing lane availability, the very factors that make fast decisions genuinely difficult rather than simply fast. These are not flaws to be apologised for; they are honest boundaries that define what the metric is and is not.
The practical value of time-to-execute lies in what it adds to player profiling. Players operating in high-tempo, high-pressure sequences will carry systematically lower xPass values under this model than the baseline would assign them, a more accurate reflection of the environment they work in. That distinction matters for recruitment and performance analysis, where context-blind completion rates have always been a crude tool.
Future work should focus on two things: better measurement of decision time using tracking data, where the gap between ball receipt and release can be observed directly, and more flexible modelling approaches that can capture the interaction effects between tempo, space, and passing angle that logistic regression smooths over. The foundation is in place. The question of how time shapes passing success is now part of the model and it should stay there.
10. Sources
Bransen, L., & Van Haaren, J. (2019). Measuring football players’ on-the-ball contributions from a pass perspective. Machine Learning, 108(2), 349–369. https://doi.org/10.1007/s10994-018-5767-3
Decroos, T., Bransen, L., Van Haaren, J., & Davis, J. (2019). Actions speak louder than goals: Valuing player actions in soccer. Proceedings of the 25th ACM SIGKDD International Conference on Knowledge Discovery & Data Mining, 1851–1861. https://doi.org/10.1145/3292500.3330758
Fernández, J., & Bornn, L. (2018). Wide open spaces: A statistical technique for measuring space creation in professional soccer. MIT Sloan Sports Analytics Conference.
Lucey, P., Bialkowski, A., Carr, P., Morgan, S., Matthews, I., & Sheikh, Y. (2015). Quality vs quantity: Improved shot prediction in soccer using strategic features from spatiotemporal data. MIT Sloan Sports Analytics Conference.
Power, P., Ruiz, H., Wei, X., & Lucey, P. (2017). Not all passes are created equal: Objectively measuring the risk and reward of passes in soccer from tracking data. Proceedings of the 23rd ACM SIGKDD International Conference on Knowledge Discovery and Data Mining, 1605–1613. https://doi.org/10.1145/3097983.3098050
Spearman, W. (2018). Beyond expected goals. MIT Sloan Sports Analytics Conference.
StatsBomb. (n.d.). Expected pass (xPass) model. Retrieved from https://statsbomb.com
Opta Sports. (n.d.). Opta event definitions. Retrieved from https://www.statsperform.com/opta-event-definitions/
Wyscout. (n.d.). Wyscout glossary and metrics definitions. Retrieved from https://wyscout.com
Sumpter, D. (2016). Soccermatics: Mathematical adventures in the beautiful game. Bloomsbury Sigma.
Discussion