Individual Match Analysis
One player, one match: touch and pressing involvement, shot and xG output, read against the player's own season baseline, not a highlight reel. A worked example below, G. Zechiël's full match report from Feyenoord 2-2 Go Ahead Eagles, Eredivisie 2026/27 MD2, built from the same event data and confidence-tiering approach as every Individual Player Analysis report: data-only, no video and no eye-test grading.
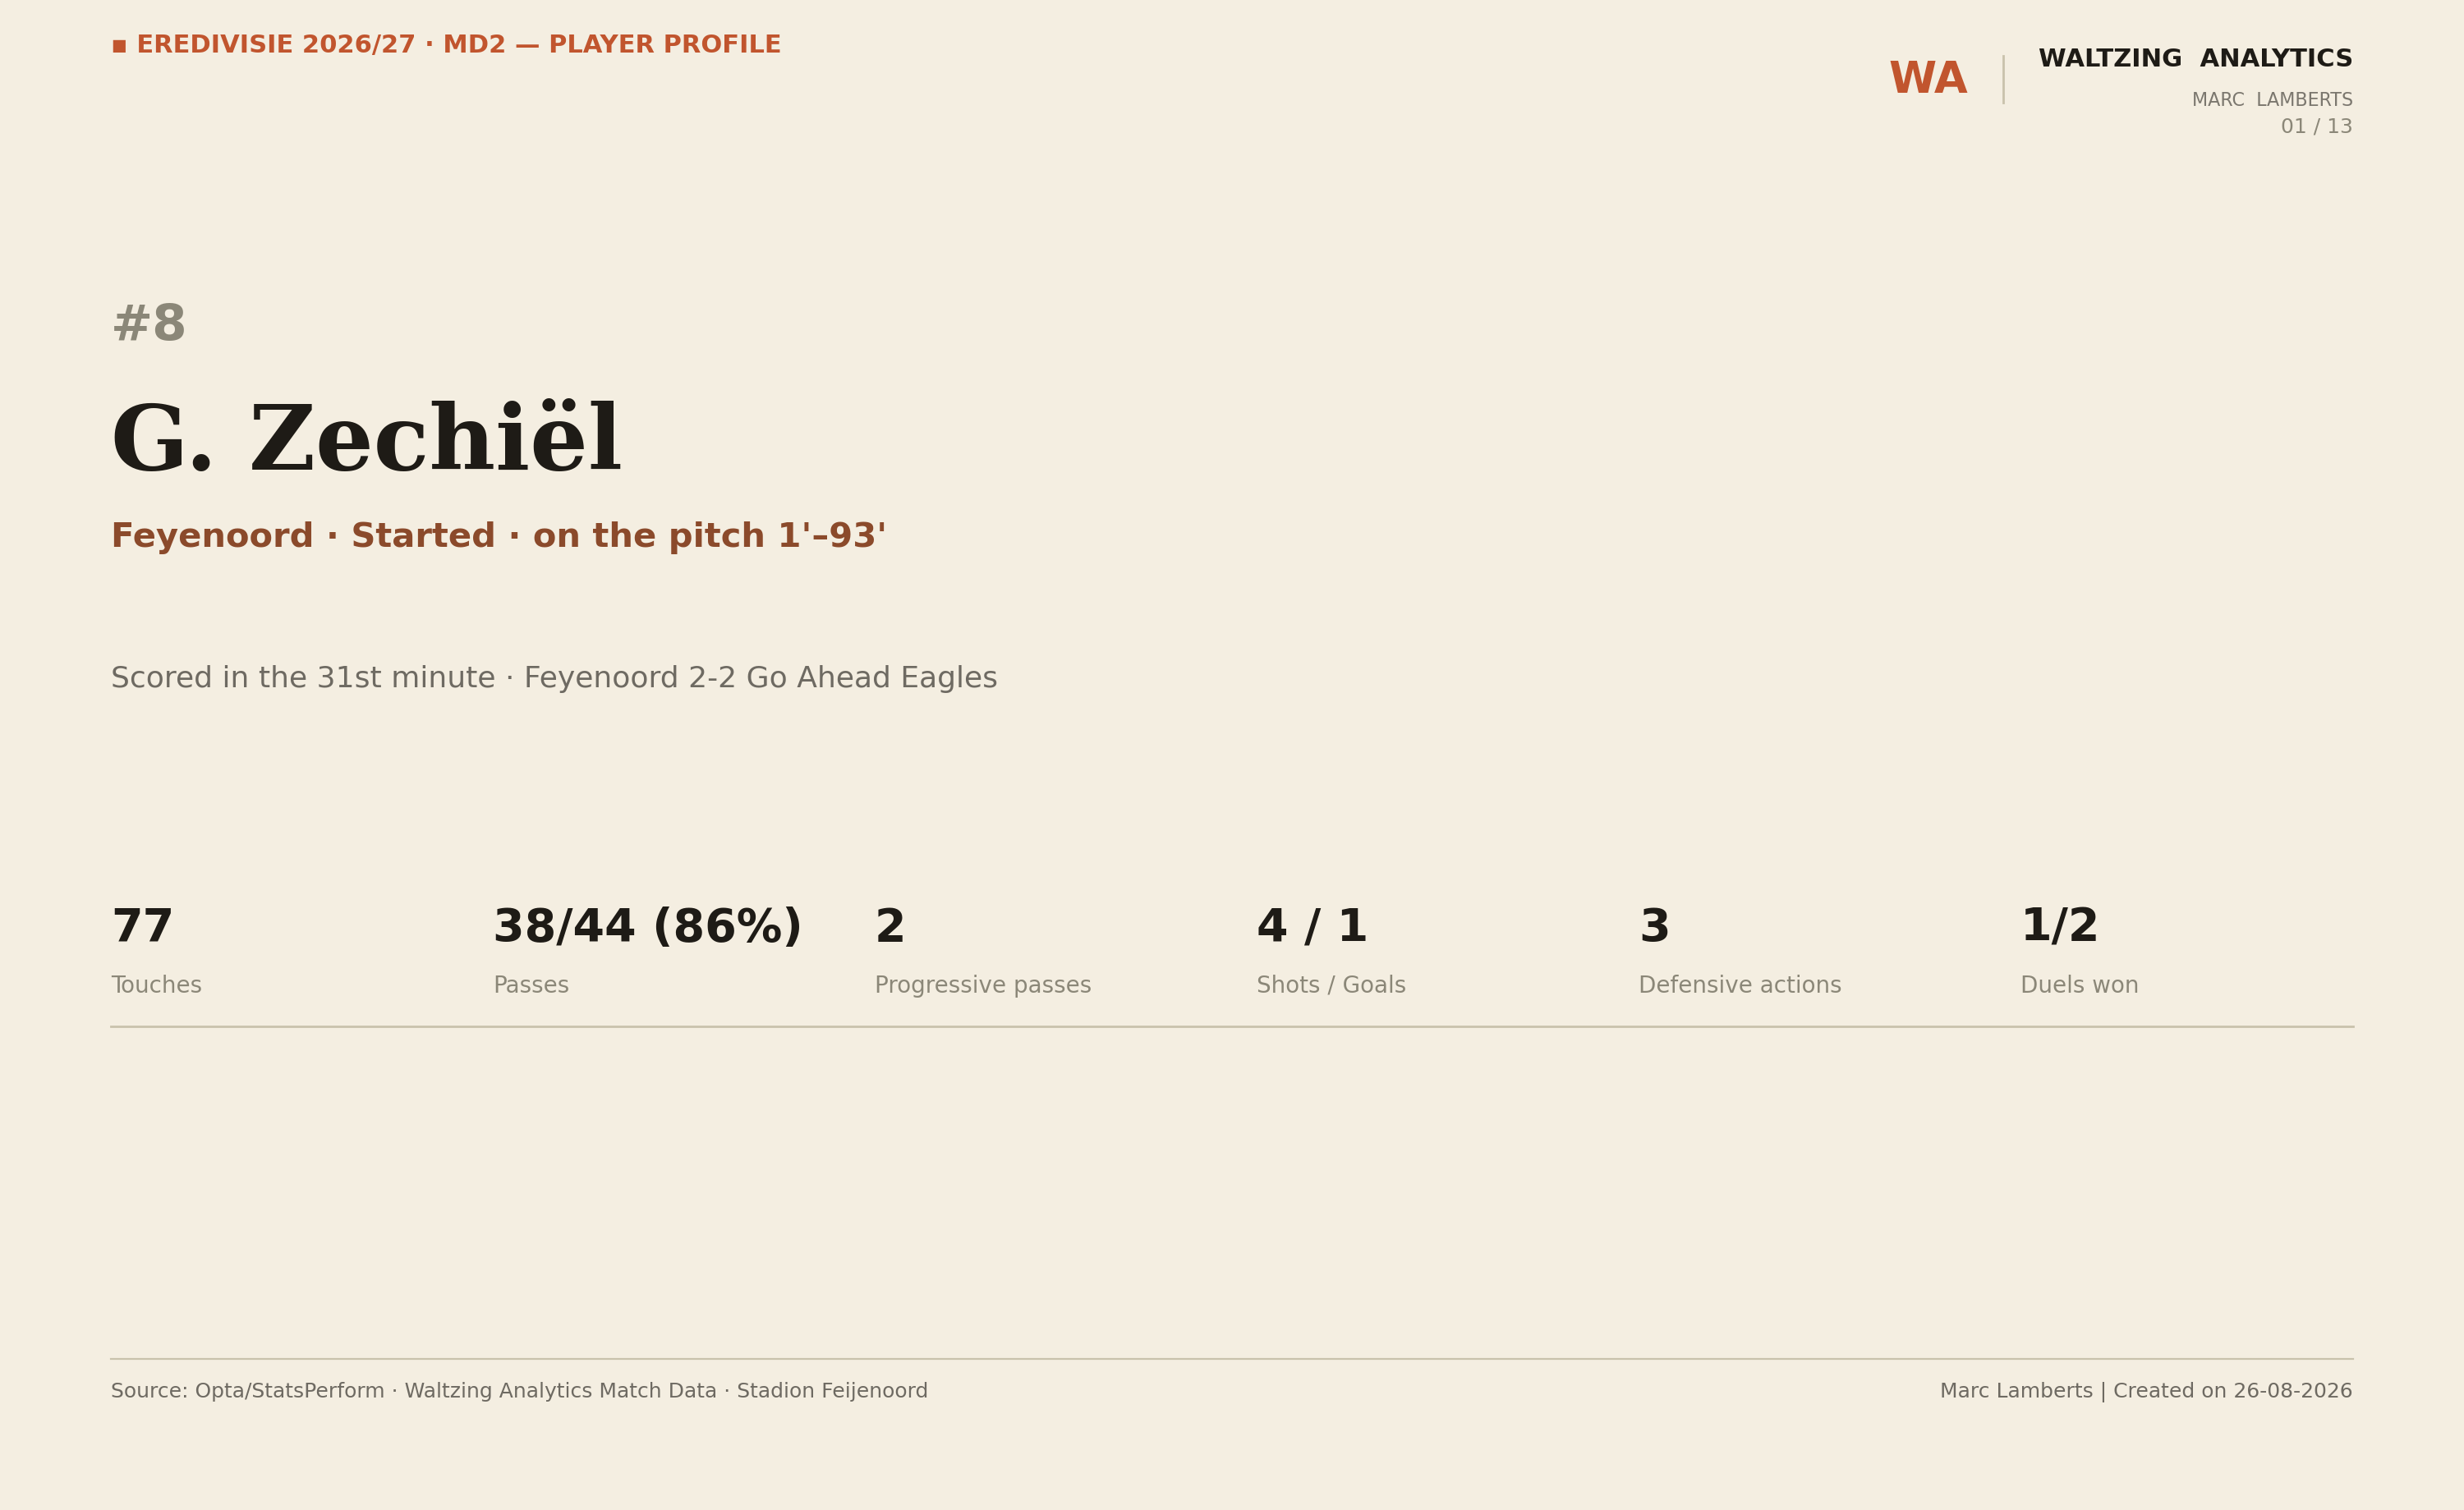
The player profile: every headline number on one page
Touches, pass completion, progressive passes, shots and goals, defensive actions and duels won, all read together rather than as isolated stats. Zechiël started, played the full 93 minutes, and scored the equalizer in the 31st minute.
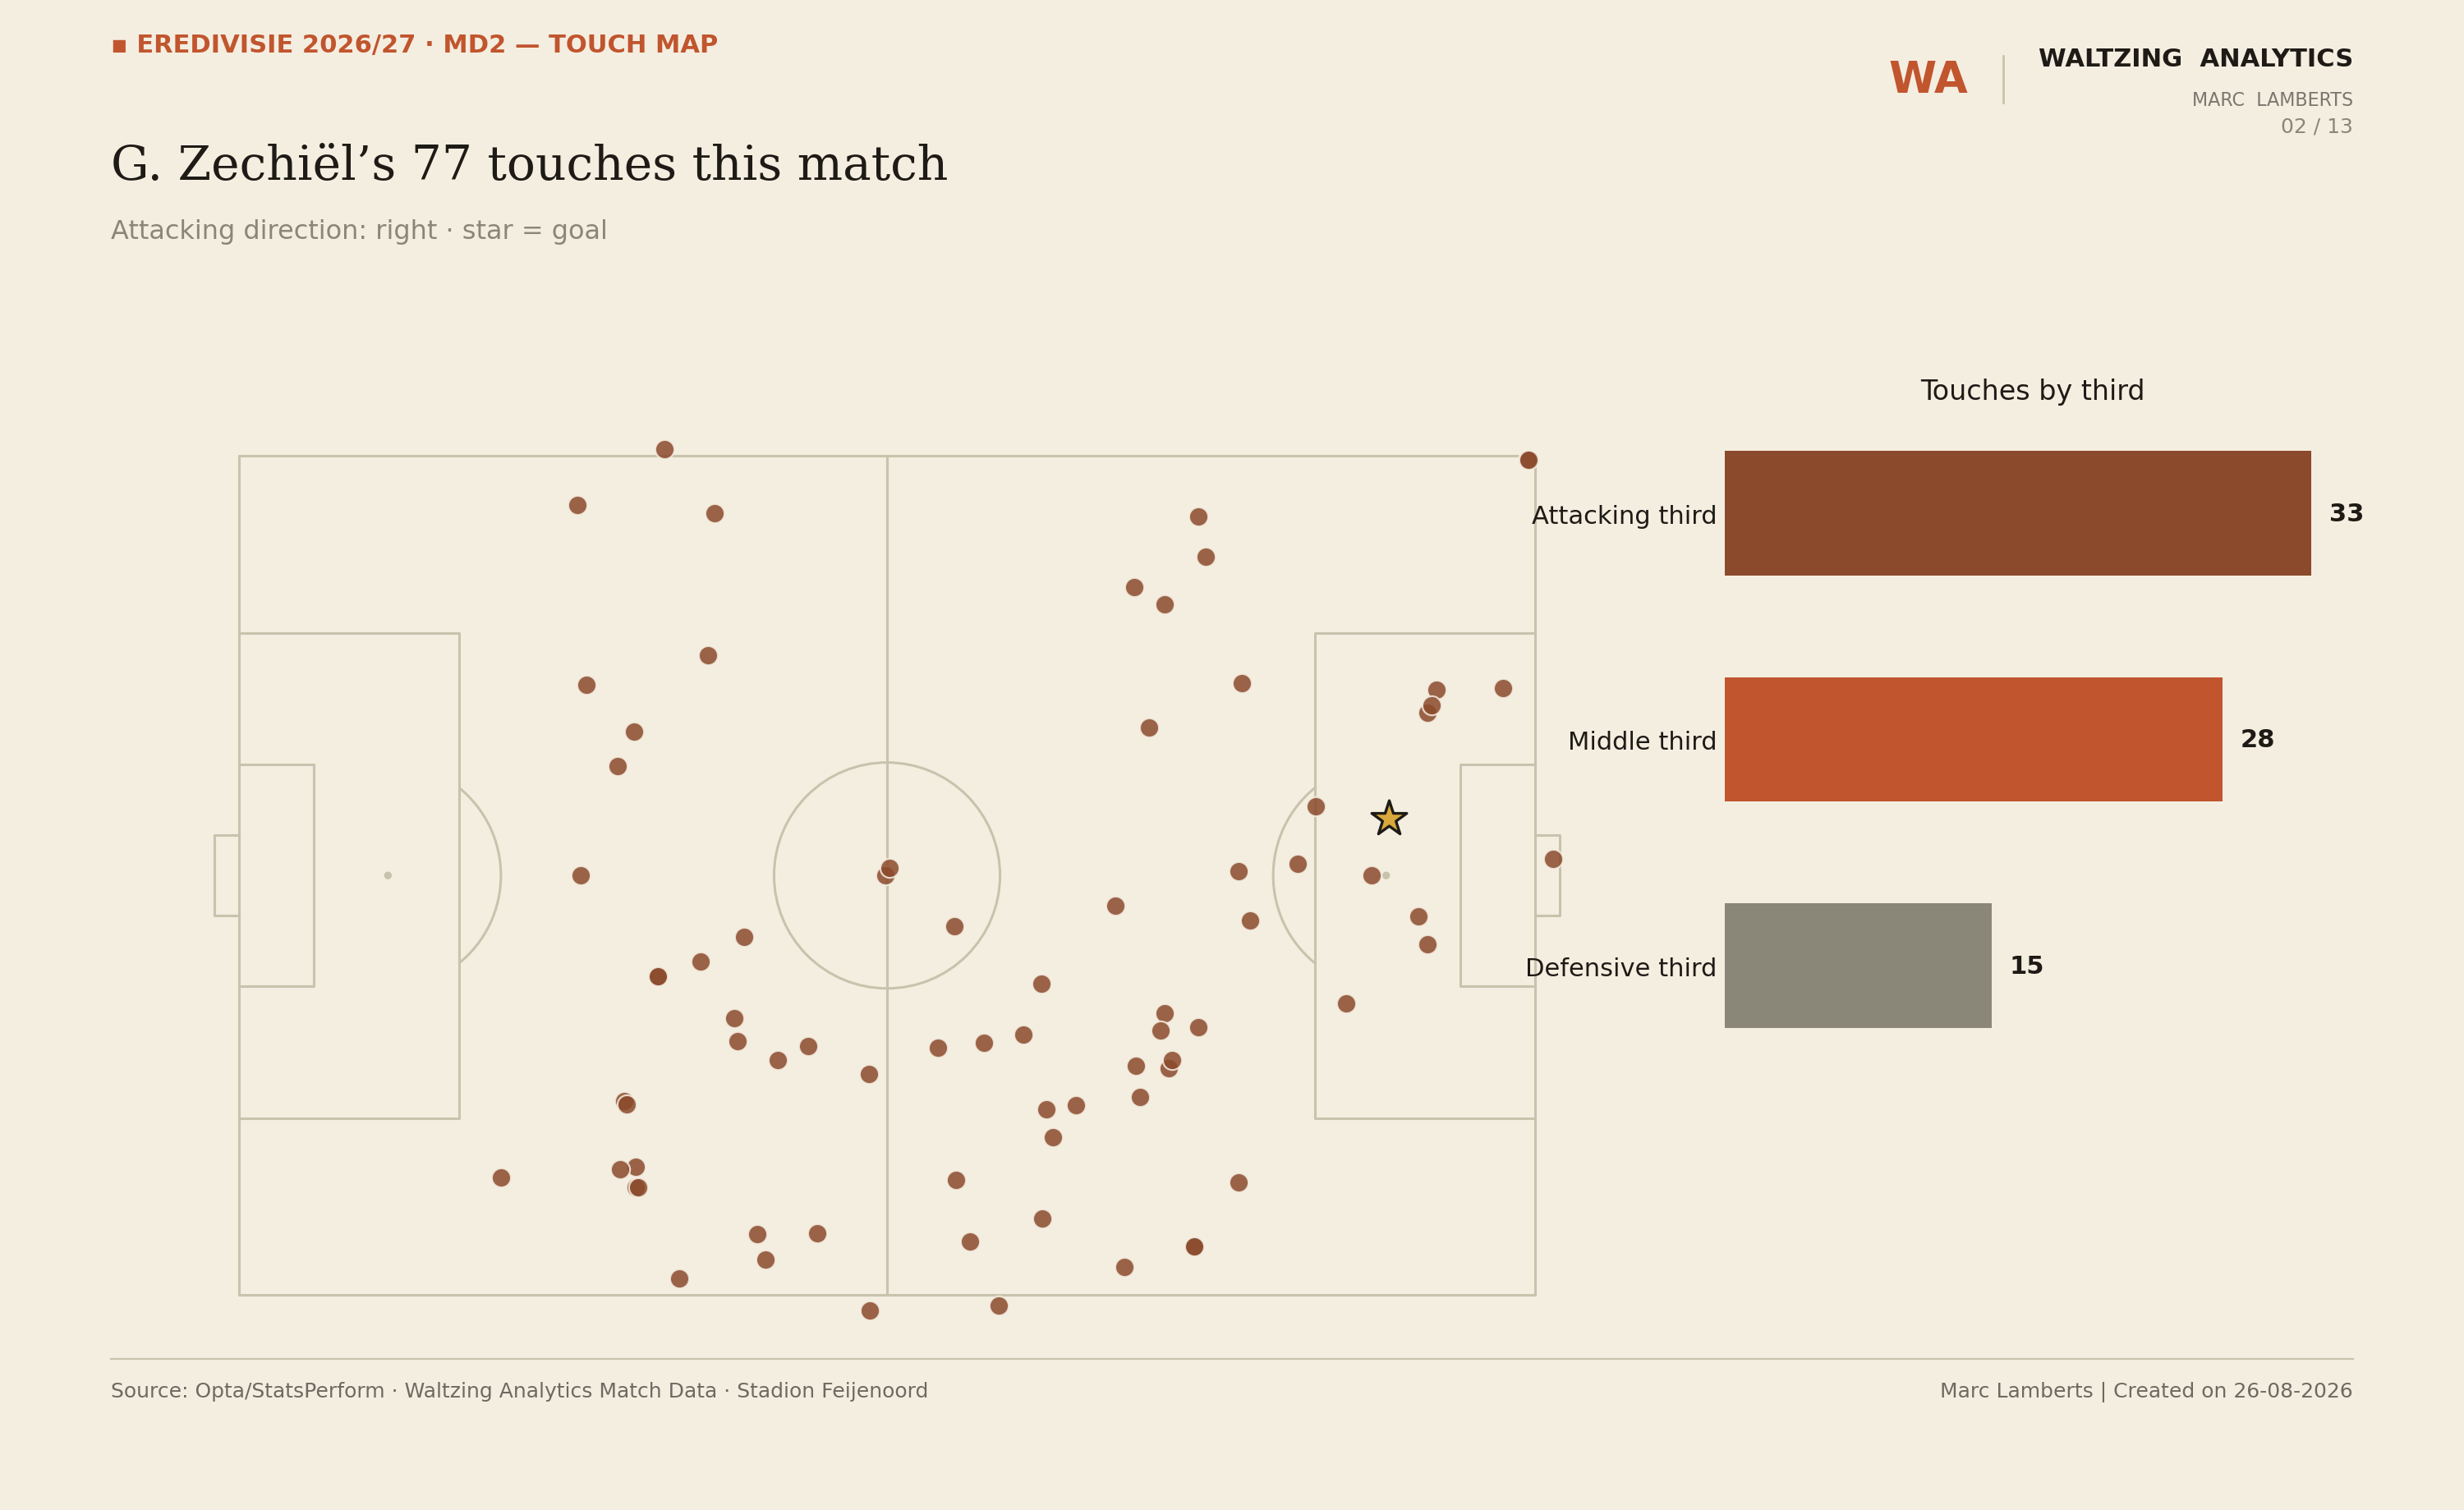
Touch and pressing involvement
Every touch, plotted and split by third, shows where a player actually spent the match rather than where the highlight clips suggest. 33 of Zechiël's 77 touches came in the attacking third, against 15 in his own defensive third, the shape of a player pinned high rather than one shuttling box to box.
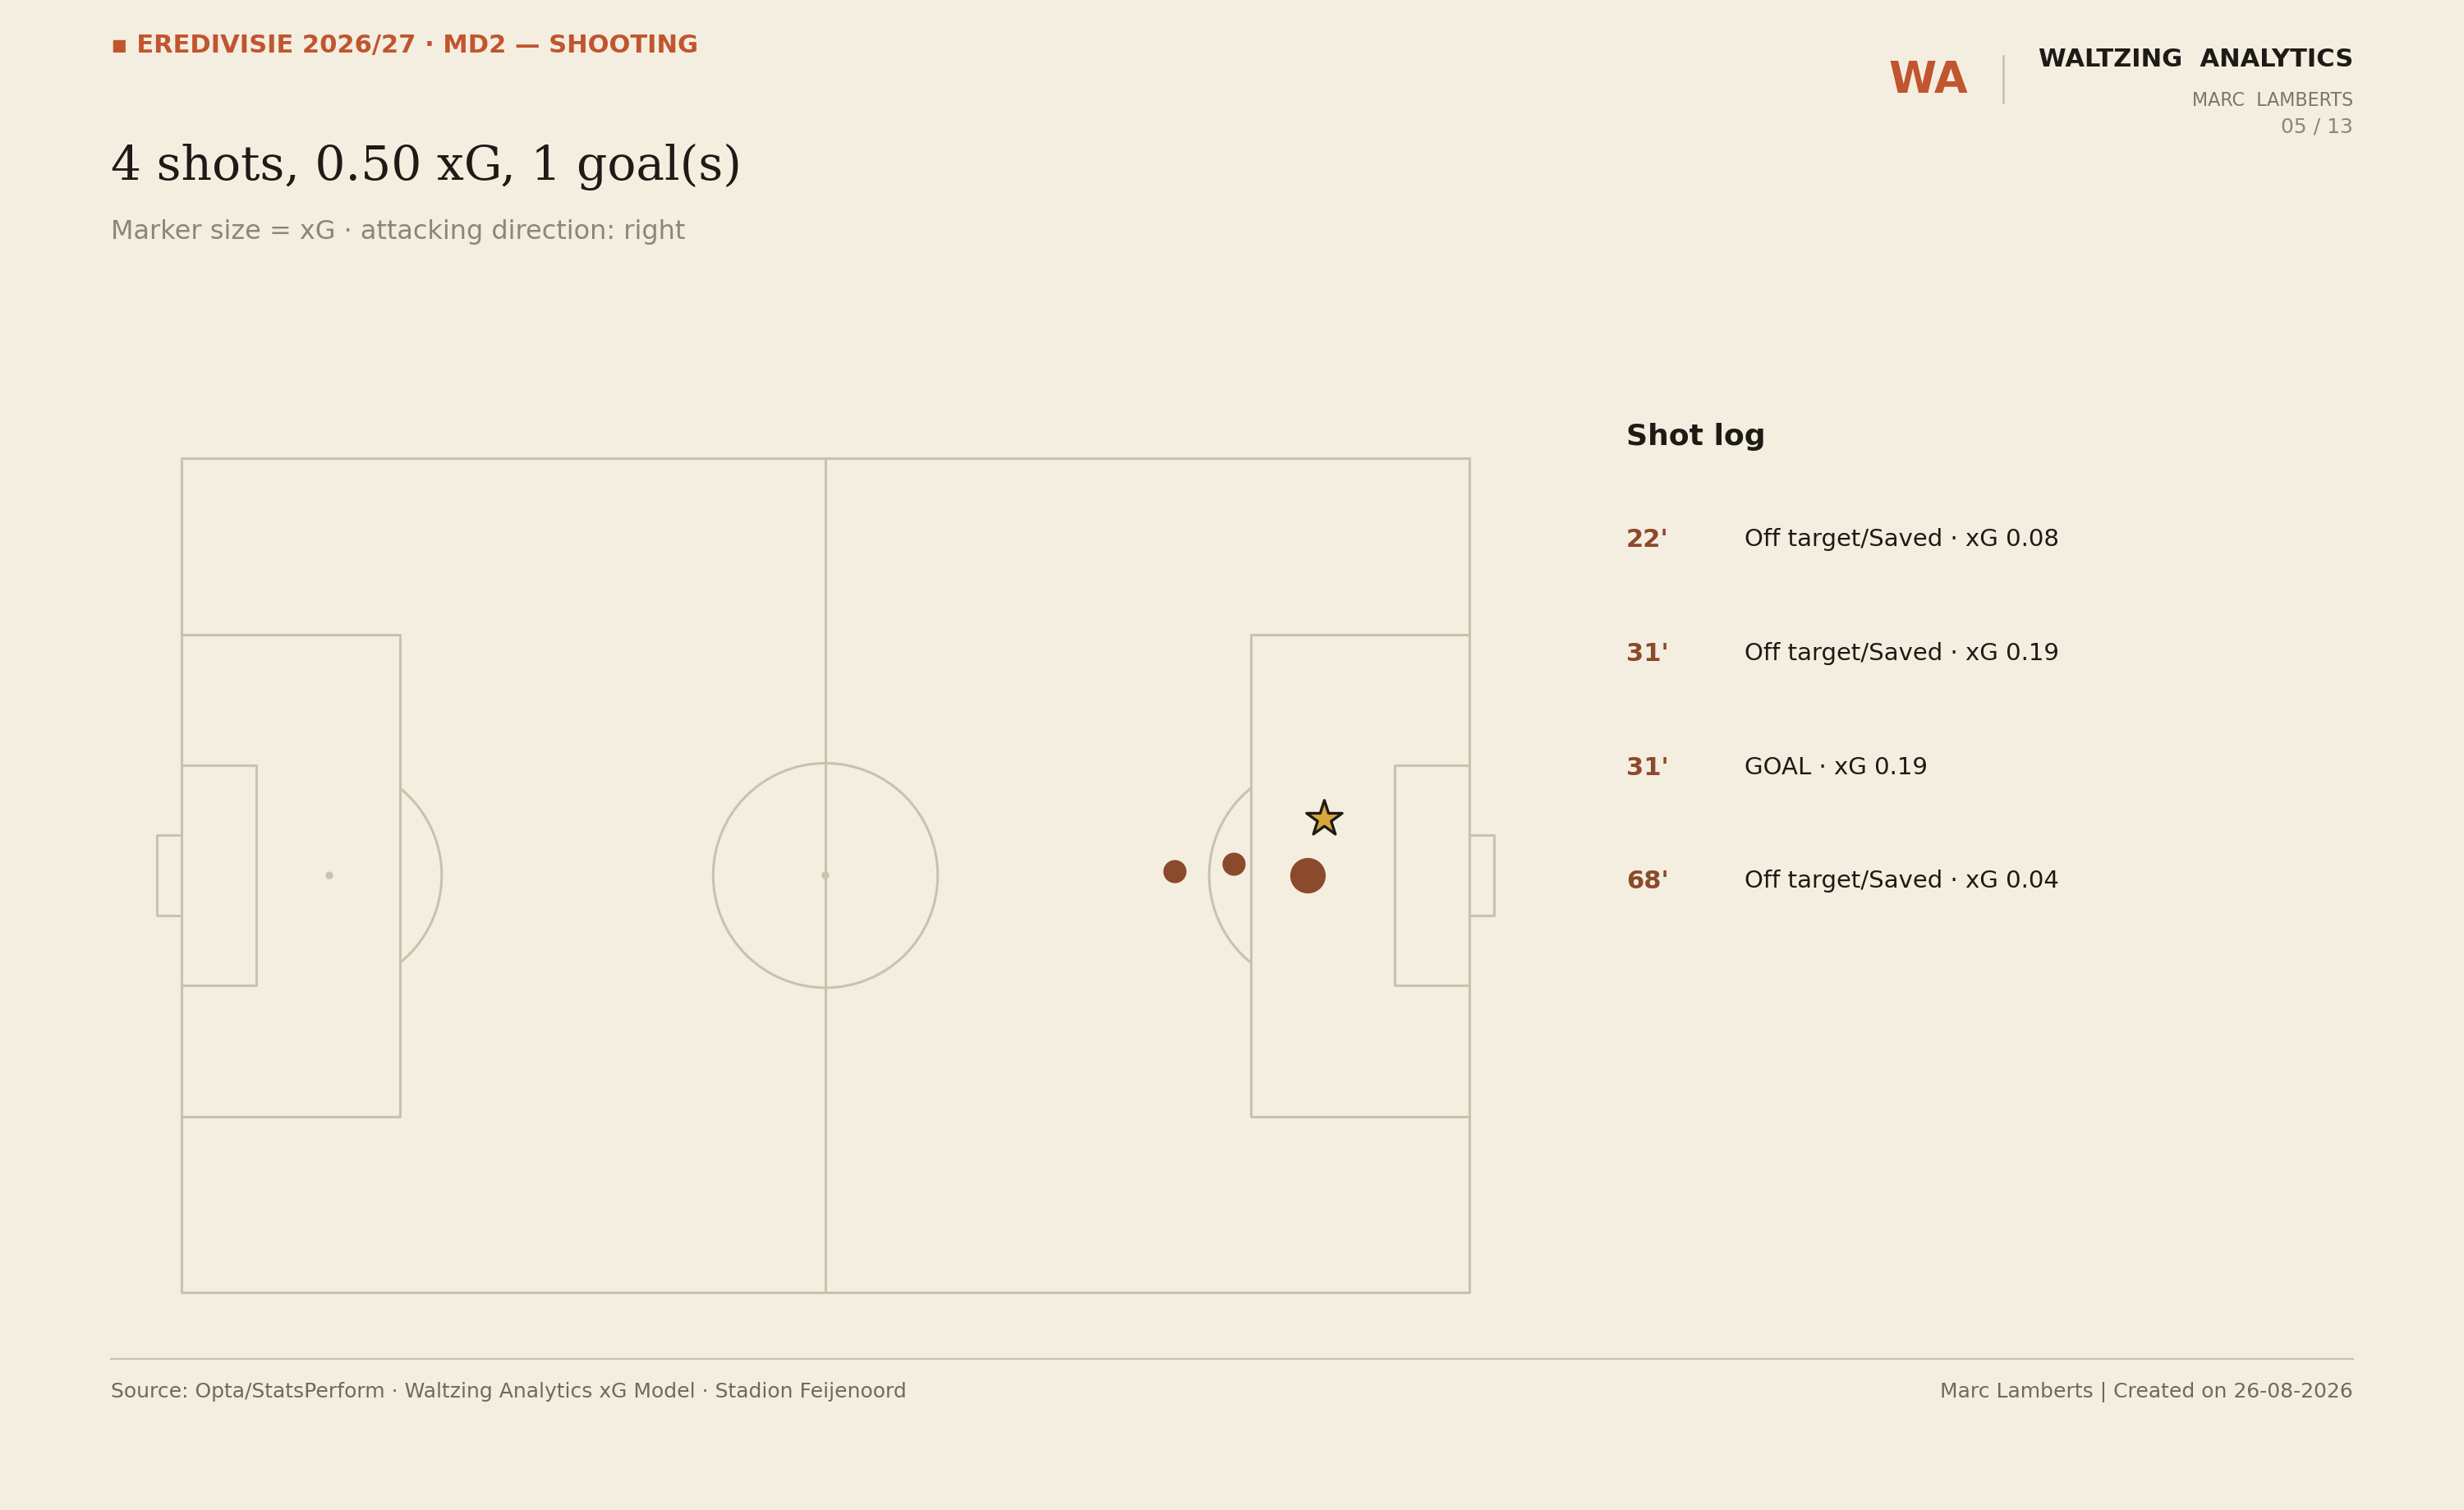
Shot and xG output
Every shot, sized by xG and logged with its minute and outcome, so a goal reads in context of the chance it actually was, not just as a scoreline entry. Zechiël's four shots totalled 0.50 xG; his goal came from the best of them, a 0.19 xG chance in the 31st minute.
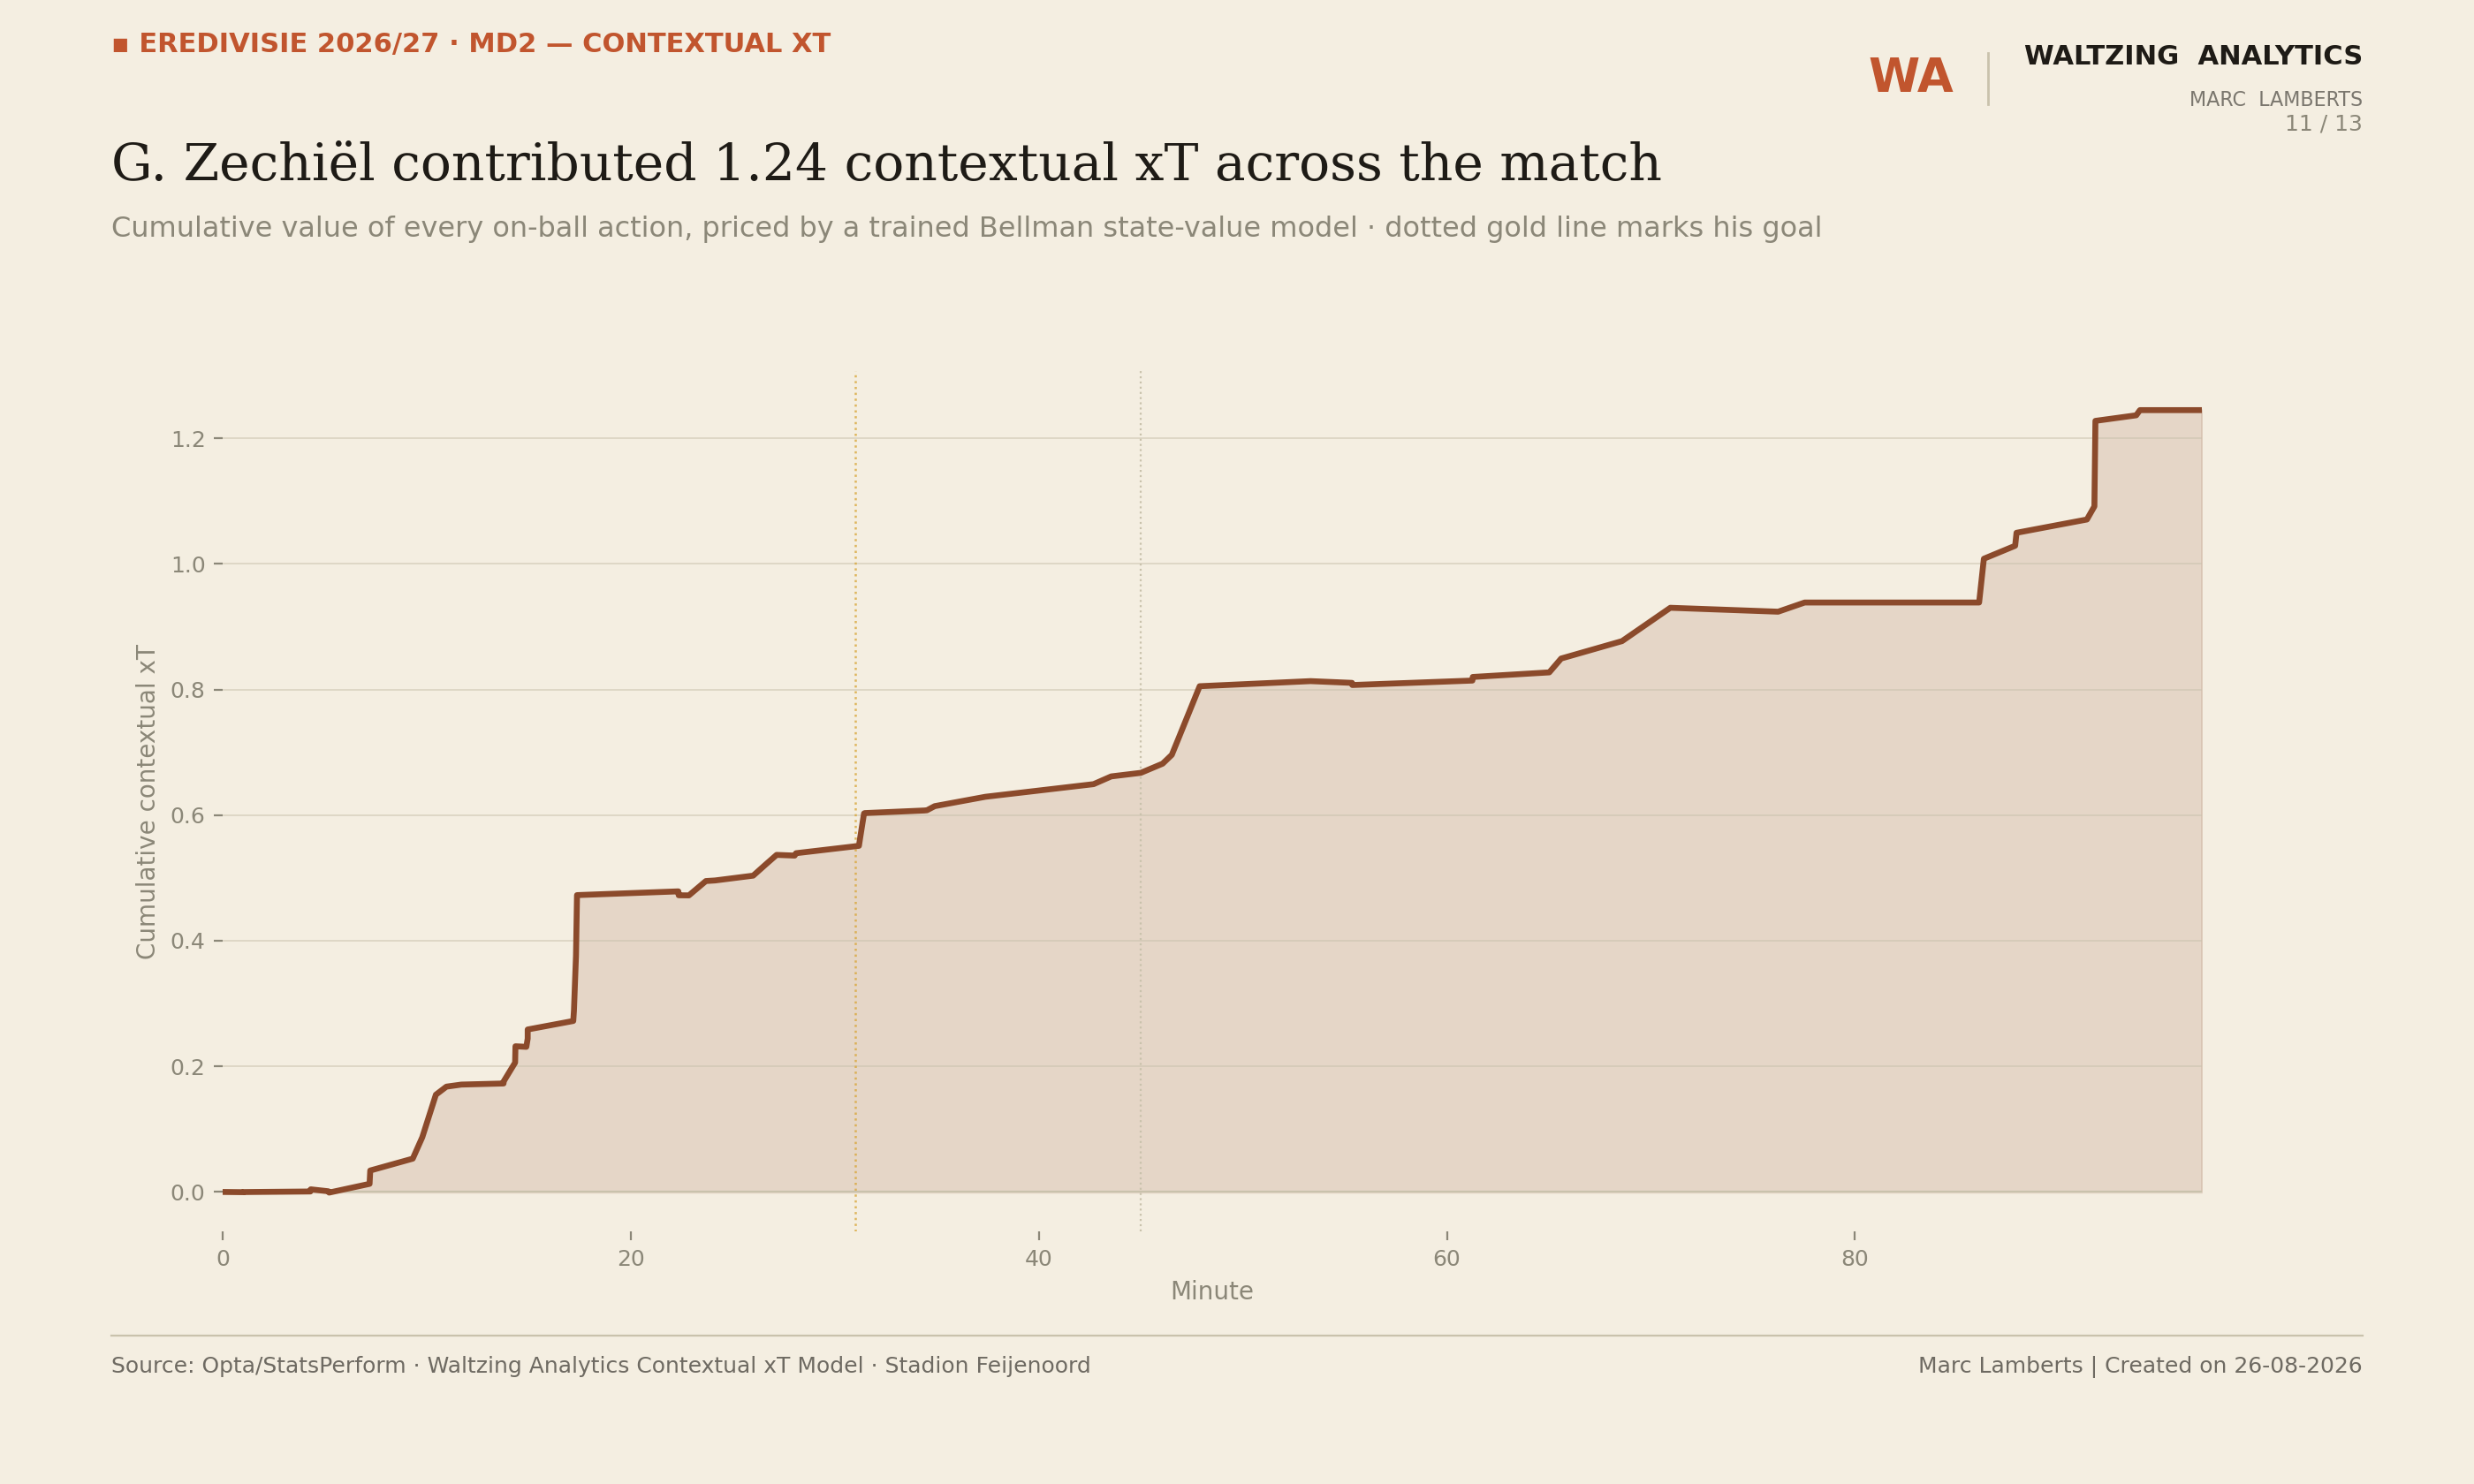
Contextual xT: the proprietary layer
Beyond touches and shots, every on-ball action is priced by Waltzing Analytics' own contextual xT model, a Bellman state-value model rather than a fixed zone grid, so the value of a pass or carry reflects the actual game state it happened in. Zechiël contributed 1.24 cumulative contextual xT across the 93 minutes, with the clearest jumps around his goal and a late second-half spell.
Delivered as a single PDF within a day or two of full-time, scoped to the match and the player you name, not a generic template run against every player on the pitch.
Get in touch to commission one for an upcoming or recent match.