Individual Season Analysis: Reading a Full Season in One Profile
The full statistical profile behind this report type: a percentile radar benchmarked against position peers, confidence-tiered metrics so a thin sample is never read the same as a full season, and the season trend rather than one static number. Every number is rolled up from the same category framework that runs the wider Waltzing Analytics player database (Shooting, xG, Passing, Progression, xT, Defending, Discipline, Ratings, and more).
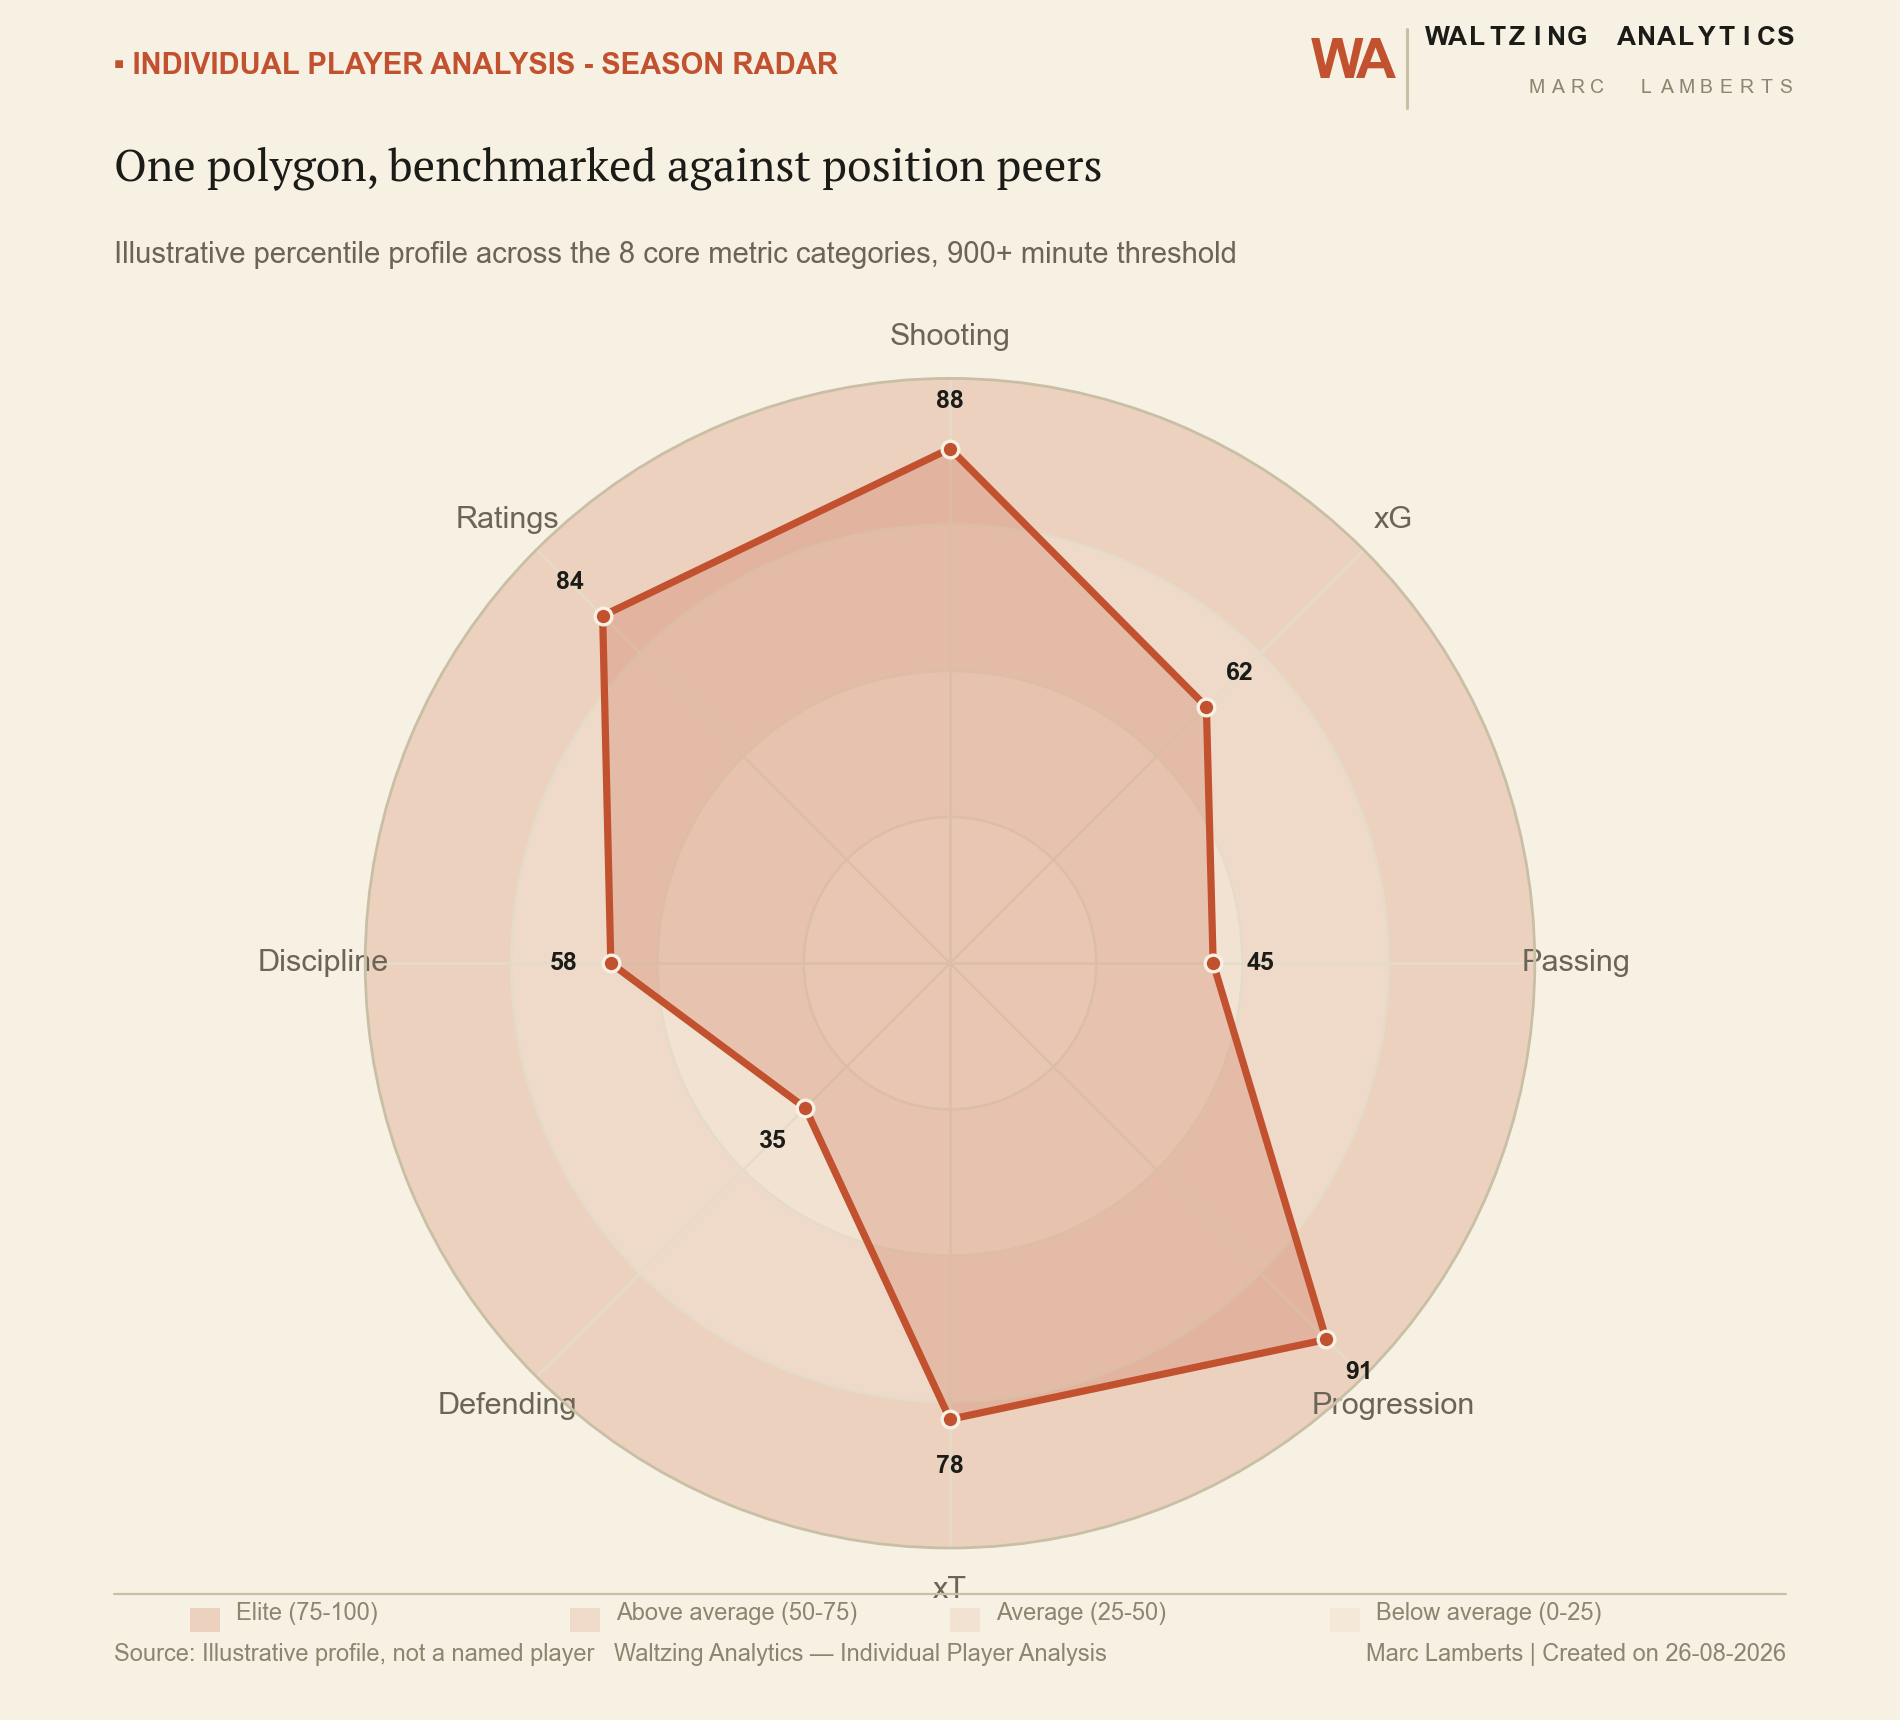
The percentile radar: one polygon, benchmarked against position peers
Each axis is a metric category, scored against the same position group and minutes threshold, not the whole league, so a full-back's progression numbers are never read against a winger's. A player who's genuinely excellent at one thing and merely adequate at everything else reads as a spike, not a smooth circle, and that shape is the point.
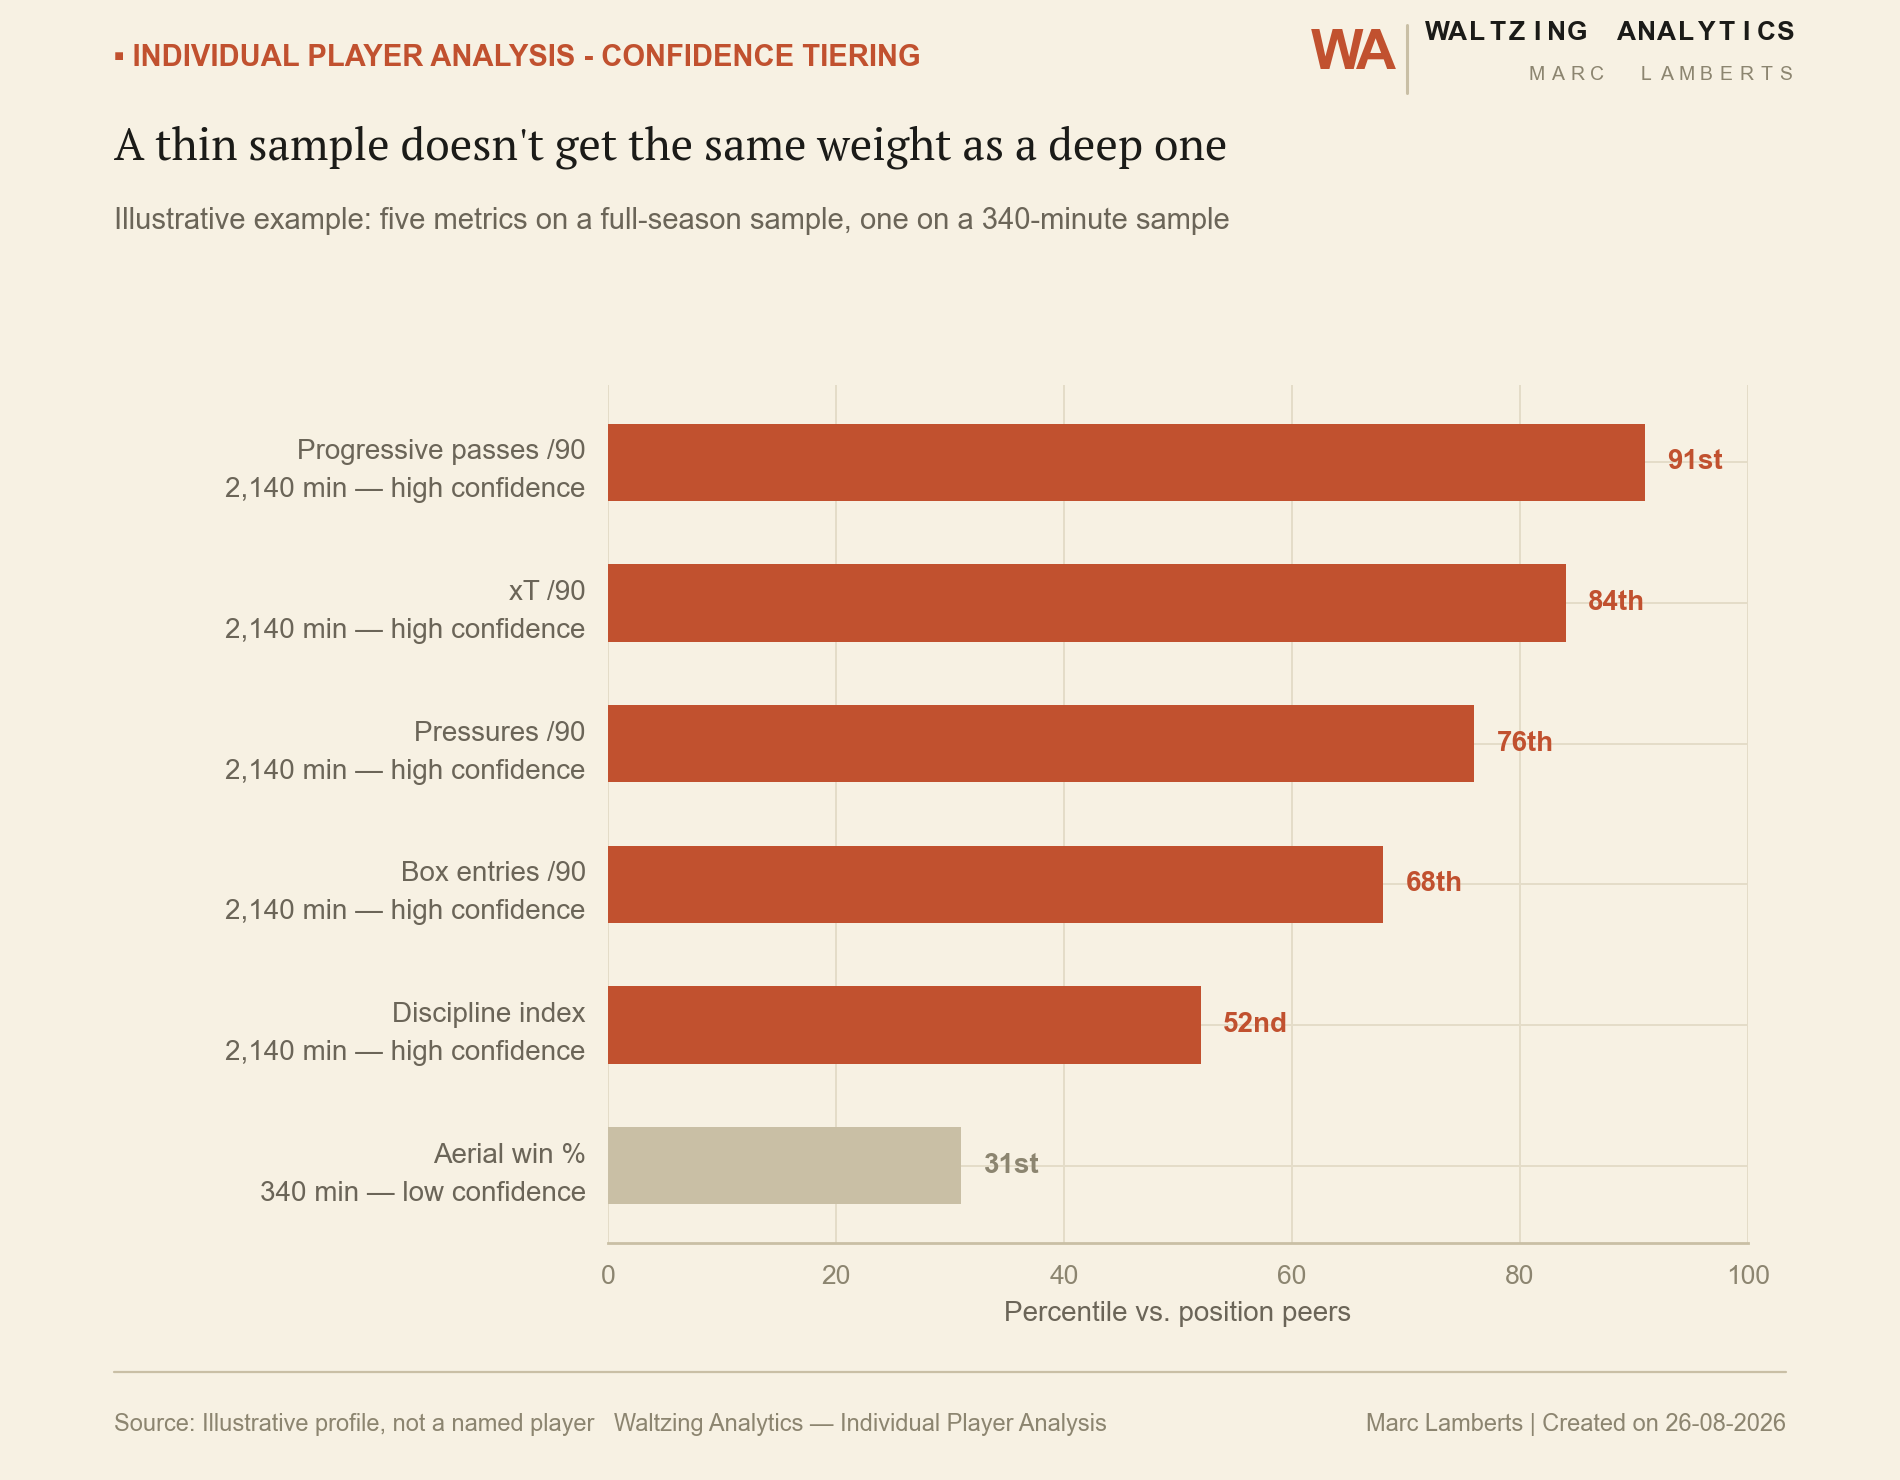
Confidence tiering: not every sample gets the same weight
Before a number goes in a report, its sample size gets checked. Five metrics below come from a full season at this player's usual minutes load; the sixth (aerial win percentage) comes from a 340-minute sample, because the role rarely puts the player in the air. The report says so, rather than presenting both with equal confidence.
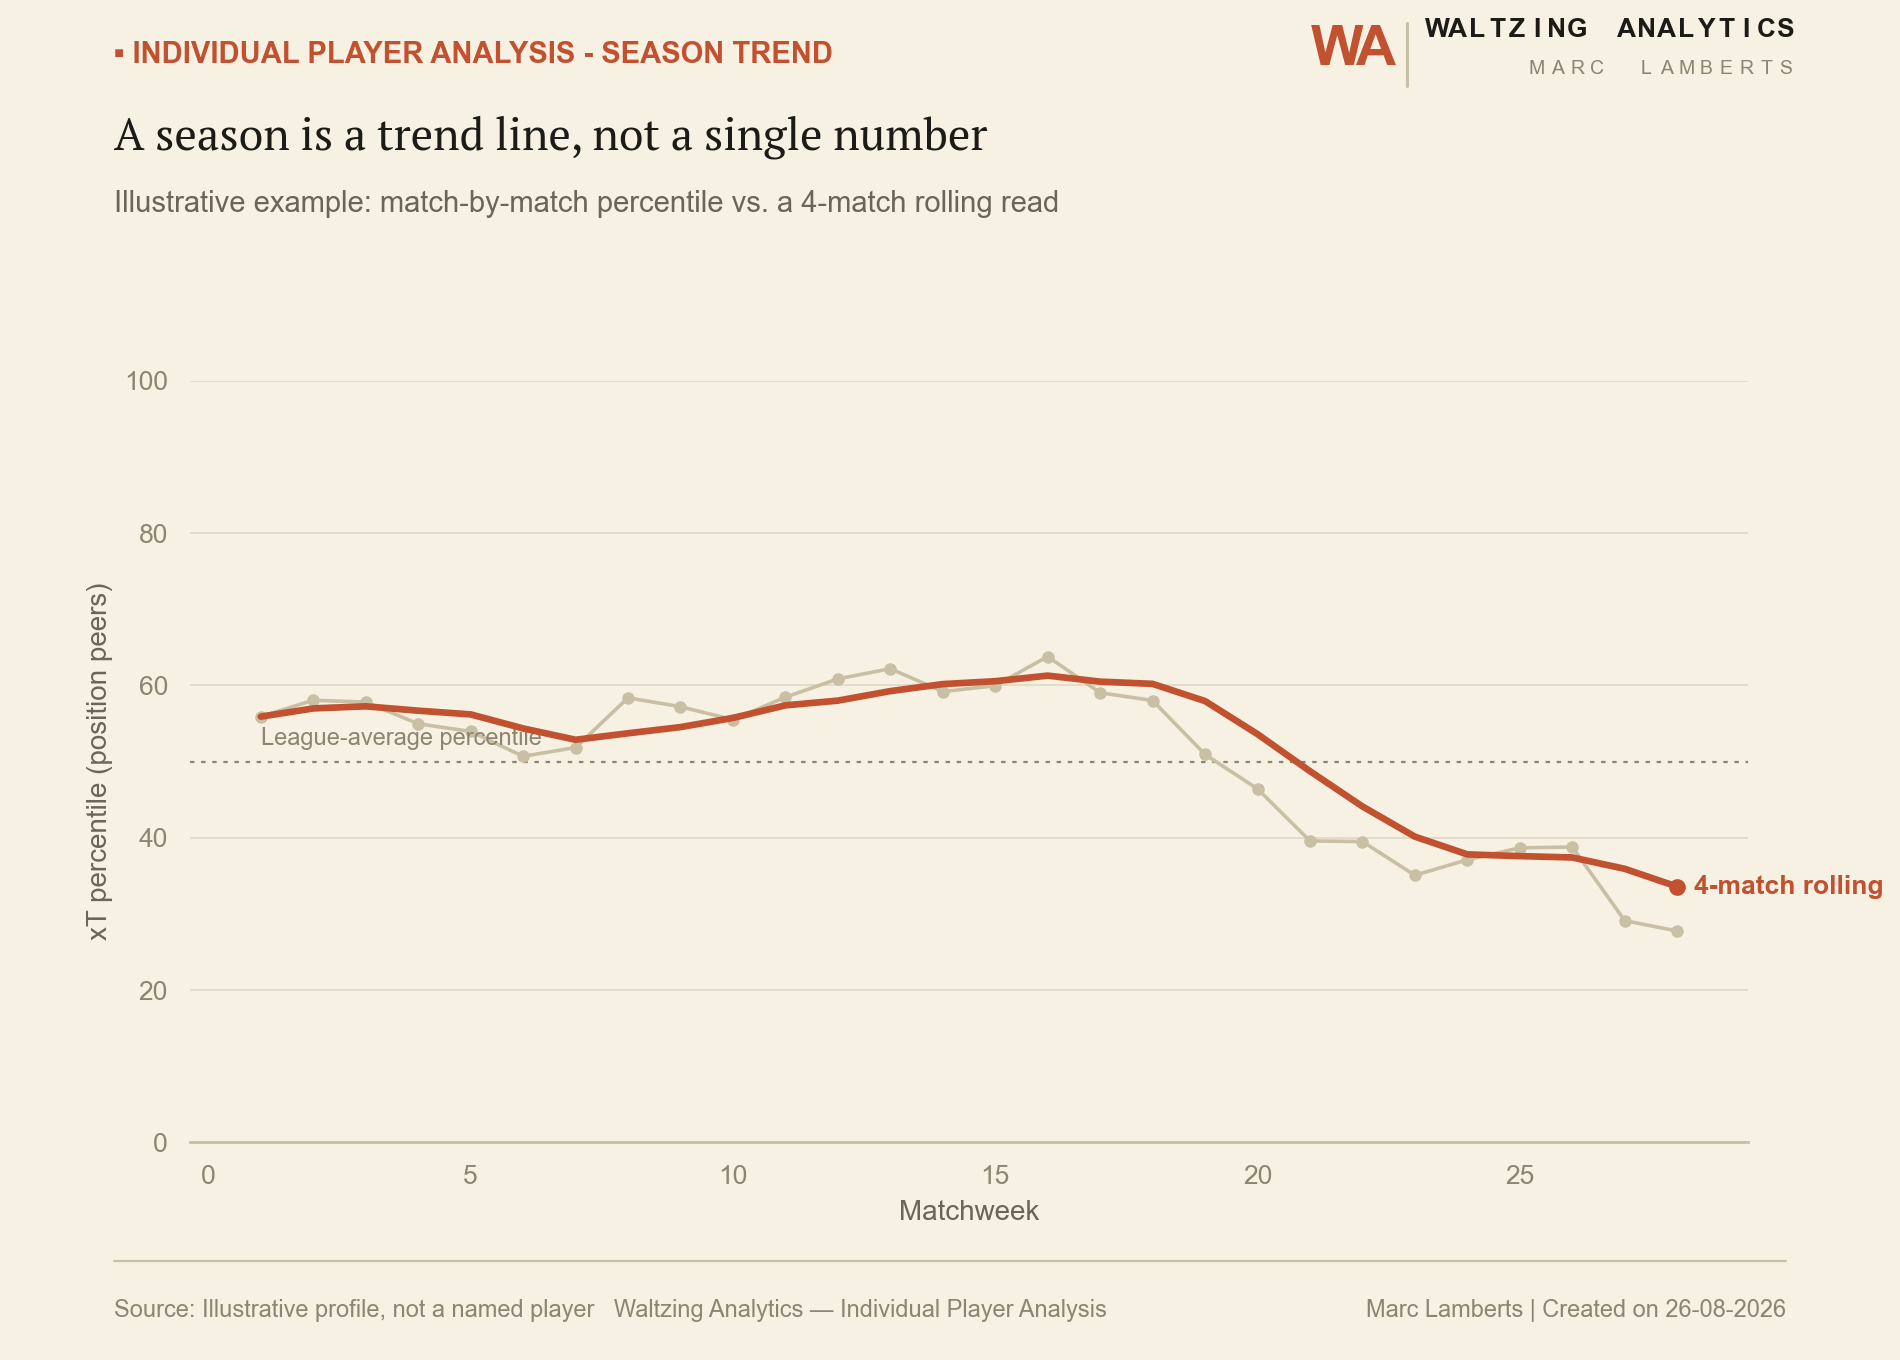
A season is a trend line, not a single number
A single-figure season average can hide a player who was excellent for three months and faded, or one who started slowly and finished the year in form. Match-by-match percentile, read against a rolling average, is what an Individual Season Analysis uses instead of one static number.
Also includes a most-similar-players table, ranked by profile distance rather than shared tags, and delivered as a single PDF for the season and player you name.
Get in touch to commission a full Individual Season Analysis.