
Goalkeeper data analysis is one of the hardest things I have experienced doing in this space. So why do I keep challenging myself to do it? The answer is two-fold. First of all, I really want to scout goalkeepers using data, because I think that’s possible. Secondly and the reasons I’m writing this article, is that not many metrics exists for the purpose I want to data scout for goalkeepers. So that’s why I think: “if it doesn’t exist, you have to make it yourself.”
I embarked on this journey with my Goalkeeper Value Model, which I created in 2025. This model looks to add value to the goalkeeper’s actions on the pitch, so we can distinguish between different levels of goalkeepers in a specific database. If you want to read more about this, you can read my stuff here:
Building on that, I want to take the next step. Well, not sure whether next step is the right word, but I want to look at a different, more niche yet very important part of the game: how do goalkeepers make their saves and if they can’t catch it, what happens with the rebound? That’s why I created the Rebound Model, which measures the value of the rebound based on the offensive/defensive quality of the player AND the safe/danger parry of the goalkeeper.
Contents
- The aim of my research and creation of the Rebound Model
- Hidden Markov Model and Markov Decision
- Data
- Methodology and calculations
- Results
- Building the model with Logistic Regression
- Goalkeeper results
- Final Thoughts
The aim of the research: creation of the Rebound Model
My idea for this model came not from football but from Basketball. I remember the episode of The Last Dance that focused on Dennis Rodman and it intrigued me. The part that intrigued me is the way he studied every shot from a player and how the rebound would happen. Which spin, which side, what rotation and what speed? Based on that, he could get the rebound: being the first player to get to the ball after the shot was missed.
This sparked my interest and this was made bigger by the fact that we look at scores of basketball players and always include their rebound. This made me think, do we have a particular equilavent in football? And, if not – what value can we bring to it?
In this research, I want to measure rebounds after a goalkeeper save, measure the value of that save, measure the value of the rebound and how players react to it. This means that there will be two types of models, one for goalkeepers and one for players. I want to add value to rebounds because they are evidently of huge influence in an attacking and defensive role of the game.
Hidden Markov Model
A Hidden Markov Model (HMM) is a probabilistic model for time-ordered sequences where you assume there’s an underlying sequence of hidden states (things you can’t directly observe) generating a sequence of observations (things you do observe). The “Markov” part means the hidden state at time t depends only on the hidden state at time t−1 (not the full history). The “hidden” part means you never see the states directly—you only see the outputs they produce.
An HMM is defined by three sets of probabilities: initial state probabilities (how likely each hidden state is at the start), transition probabilities (how likely the model is to move from one hidden state to another), and emission probabilities (how likely each observation is given a particular hidden state). With those, you can answer three core questions: (1) Evaluation: how likely is an observation sequence under the model? (2) Decoding: what hidden-state path most likely produced the observations (often via Viterbi)? (3) Learning: how to fit the model parameters from data (often via EM / Baum–Welch).
Methodology: Modelling Post-Save Rebound Sequences with Hidden Markov Models
The way I approach this model comes from a simple idea: rebounds matter, but in football, we do not really treat them as something we can properly measure. In basketball, rebounds are a fundamental part of how we evaluate players and teams. In football, once a goalkeeper makes a save, the analysis often stops there. What happens next is usually reduced to whether a goal is conceded or not. This model is built on the belief that it misses a large and important part of the game.
Instead of treating a save as a single, isolated event, I treat it as the start of a short sequence. After a save, the ball is often still in play, players react, space opens or closes, and danger can either disappear or escalate very quickly. To capture this, every save becomes the anchor of a short time window in which all subsequent actions are observed. If the goalkeeper clearly collects the ball, the sequence ends immediately. If not, the rebound phase continues and becomes the object of analysis.
To make this tractable, I reduce the chaos of post-save play into a small number of meaningful event types: clearances, duels, shots, additional saves, and goals. These are the actions that actually decide whether a rebound turns into control or danger. Rather than trying to judge these moments with fixed rules, I use a Hidden Markov Model to learn recurring patterns in how rebounds evolve. The idea is that there are underlying “states” of play after a save—some calm and controlled, others chaotic and dangerous—that we cannot observe directly, but that reveal themselves through the sequence of actions that follows.
Once the model is trained, each rebound sequence can be described in terms of how long it stays “alive” and how quickly danger appears. A rebound that immediately leads to a duel or a shot looks very different from one that is resolved with a quick clearance or collection, even if neither results in a goal. This allows me to move away from binary thinking (goal vs. no goal) and toward a more continuous view of rebound control and rebound threat.
Importantly, this framework naturally leads to two perspectives. From the goalkeeper’s side, the question becomes: how well does a save turn into control? Does the goalkeeper consistently kill danger, or do their saves often lead to extended pressure? From the outfield player’s side, the question shifts to: who reacts best to rebounds? Which players consistently protect their own goalkeeper, and which players are best at exploiting rebounds against the opposition?
By modelling rebounds as sequences rather than moments, this methodology assigns explicit analytical value to something that is clearly influential in football but rarely measured directly. In that sense, the approach mirrors how rebounds are understood in basketball: not just as outcomes, but as repeatable, learnable patterns that separate good performers from great ones.

Calculations
Once rebounds are framed as short sequences rather than isolated events, the next challenge is deciding what to measure and how to measure it. The goal here is not to build a single “perfect” number, but to extract multiple signals that describe how a rebound develops: how dangerous it becomes, how quickly it is resolved, and which players are responsible for that outcome.
I approach this from two angles. First, I use probabilistic models to understand how rebound sequences typically evolve and end. Second, I compute a set of intuitive, football-driven metrics that describe space, time, and outcomes. Together, these form the basis for goalkeeper and player evaluation.
To establish a baseline understanding of rebound outcomes, I model the post-save phase as a simple absorbing Markov process. The idea is straightforward: once a save occurs, play either continues for a short period or eventually resolves into one of two terminal outcomes—safety or conceding a goal. By tracking how often rebound sequences transition from one action to the next before reaching one of these endpoints, I can estimate how dangerous a typical rebound situation is, independent of who the goalkeeper or players are.
From this model, two quantities are especially useful. The first is the probability that a rebound sequence ultimately results in a goal. The second is the expected number of actions before the rebound is resolved. Together, these tell us not only how risky rebounds are on average, but also how long pressure tends to last after a save.
While the Markov chain describes how rebounds end, it does not capture how they feel as they unfold. For that, I use a Hidden Markov Model. Here, the assumption is that there is an underlying rebound context, something like “controlled” or “chaotic”, that we cannot observe directly. What we do observe are the actions that follow the save: duels, clearances, shots, or goals.
The HMM learns these latent rebound states directly from data by looking at which actions tend to cluster together and how sequences move between them. After training, some states clearly correspond to calm situations that are quickly resolved, while others correspond to extended pressure with a high likelihood of shots or goals. Importantly, these states are not defined in advance; they emerge from the patterns in the data.
For each rebound sequence, I then calculate how much time it spends in the “live” state and whether the sequence is already live from the very first post-save action. These measures capture something that traditional metrics miss: two saves can both avoid a goal, but one can still leave the defense under far more pressure than the other.
Probability models alone are not enough, so I also calculate a set of direct, interpretable metrics based on where and when rebounds occur. Spatially, the location of the first meaningful post-save action is classified into danger zones based on proximity and angle to goal. A rebound that drops centrally and close to goal is treated very differently from one that spills wide or away from the box.
Temporally, I measure how quickly the first action occurs after the save and whether key events happen in an “immediate” window following the save. Fast reactions often indicate disorganization or poor control, while slower, delayed actions typically reflect better defensive structure or ball security.
Results
The first thing that stands out to me is that most saves do not immediately “kill” the situation, even when no goal follows. When you look at the episode summaries, a large proportion of saves lead to at least one additional meaningful action, and many lead to several. This confirms the original intuition behind the model: a save is often not the end of the defensive problem, it is simply the beginning of a new phase. The fact that average episode lengths regularly exceed two events suggests that rebounds are not rare edge cases, but a structural part of how attacking pressure is sustained.
What I find especially interesting is how clearly the Hidden Markov Model separates different rebound environments. One latent state is almost entirely driven by duels, which aligns very well with the idea of a “live” rebound—scrappy, contested, unstable situations where neither team has clear control. Another state is dominated by quiet moments, collections, and clearances, which fits the intuition of a rebound being effectively neutralized. Importantly, these states are learned from the data, not imposed. The model is effectively rediscovering, on its own, the difference between chaos and control after a save.
From a goalkeeper perspective, the Rebound Control Index reinforces this idea that not all non-goals are equal. Some goalkeepers show similar goal-concession rates, but very different rebound profiles. A higher RCI tends to be associated with quicker resolution, fewer dangerous parries, and rebounds that are pushed further away from high-value zones. In contrast, lower RCI values often come from goalkeepers whose saves consistently lead to extended sequences, second saves, or rebounds remaining centrally located. This is exactly the kind of separation that traditional save percentages fail to capture.
Another result I find revealing is how time and distance matter more than outcomes. Mean time to first meaningful action and rebound distance vary meaningfully across goalkeepers, even when goal rates do not. This suggests that some goalkeepers are systematically better at buying time for their defense or pushing the ball into less threatening areas, even if those actions do not show up directly as goals prevented. In that sense, rebound control looks much closer to positioning and anticipation—similar to Rodman’s approach in basketball—than to pure shot-stopping.
Finally, when the rebound sequences are attributed to players, the results underline that rebounds are a shared responsibility. Certain players consistently appear as first responders after saves, either clearing danger for their own goalkeeper or creating immediate threat against the opposition. These contributions are usually invisible in standard metrics, but here they show up as repeatable patterns. Some players specialize in stabilizing chaos; others specialize in exploiting it. That split feels both intuitive when watching matches and validating when it appears in the data.
Overall, the results support the core idea behind the model: rebounds are not random, and they are not just noise around saves. They follow patterns, they reflect skill and decision-making, and they have a measurable impact on both defensive solidity and attacking threat. By treating rebounds as sequences rather than moments, the model uncovers value that has been hiding in plain sight.

Building a goalkeeper model
After I have ran the calculations, I get a set of different csv files: Comprehensive player actions, Goalkeeper report, HMM State report and rebound analysis. From these reports/files, I get a lot of information about the hidden markov model as well as the rebounds, but I want to build a model that values these post-save sequences from a goalkeeper’s side. In other words, how good is a goalkeeper in:
- Making a parried save that goes into a “Safe” zone?
- Recovering after a parried save and positioning themselves for a second save?
And you know what? This is not a singular model; these are two different models. Both models were estimated using regularised logistic regression, which predicts the probability of a binary outcome as a smooth function of input features via the logistic link. Logistic regression is well suited to this setting because it produces calibrated probability estimates rather than arbitrary scores, allowing expected post-save risk to be interpreted directly and aggregated across episodes. An elastic-net penalty combining L1 and L2 regularisation was applied during estimation. The L1 component encourages sparsity by shrinking weak or redundant coefficients to zero, effectively performing feature selection in the presence of highly correlated predictors such as rebound geometry, danger flags, and recovery indicators. The L2 component stabilises coefficient estimates by shrinking large weights, reducing variance and preventing overfitting, which is particularly important given the rarity of post-save goals. Together, this combination yields models that are interpretable, robust to multicollinearity, and well calibrated out of sample.
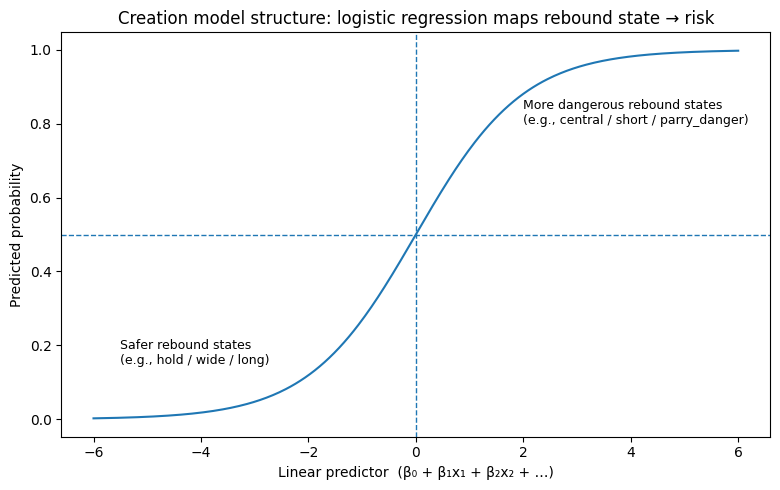
Parry Quality Value (PQV). This measures the technique of a goalkeeper as it answers the question: How dangerous are the rebound situations a goalkeeper creates with their saves?
The first model estimates the probability of a rebound shot or goal using only features that describe the state created by the goalkeeper’s save itself. These inputs include the save outcome (e.g. hold, safe parry, dangerous parry), the spatial location of the save, and the geometry of the rebound such as distance, angle, and whether the ball is redirected into a high-danger zone. By excluding all subsequent recovery actions, timing variables, and defensive interventions, this model isolates the intrinsic risk associated with the goalkeeper’s parrying technique and ball control. The resulting predicted probability represents the expected level of danger immediately created by the save, independent of how the subsequent sequence unfolds. Aggregating these probabilities across a goalkeeper’s episodes forms the basis of the Parry Quality Value (PQV), a measure intended to capture how consistently a goalkeeper creates safe post-save situations.
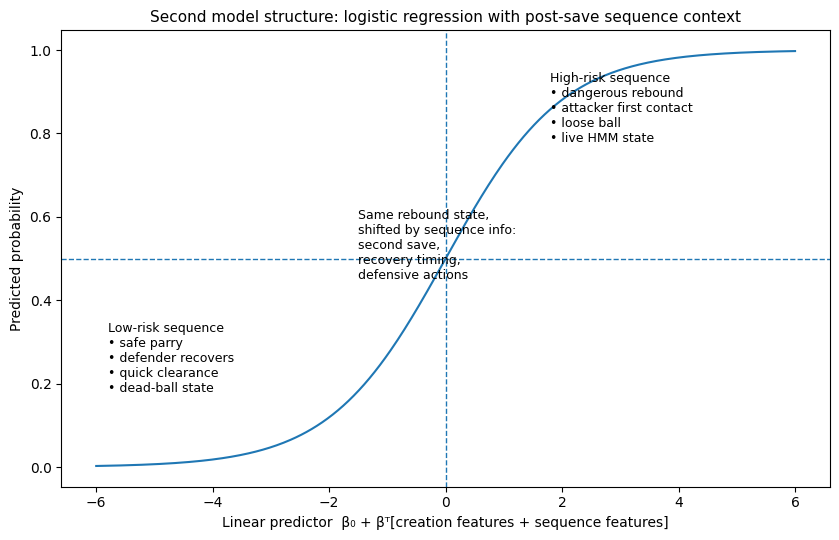
The second model is the Post-Save Sequence Value. It extends the first model by incorporating information about what happens during the post-save sequence itself, including early recovery timing, opponent or defender first contact, secondary saves, clearances, duels, and contextual indicators derived from sequence or state models. This richer feature set allows the model to condition expected risk on how the rebound phase actually develops, rather than on the initial parry alone. The predicted probability from this model therefore, reflects the expected likelihood of a shot or goal given both the rebound state and the subsequent actions taken during the scramble. By comparing the observed outcome to this conditional expectation and aggregating the resulting residuals at the goalkeeper level, the model yields the Post-Save Sequence Value (PSSV), which quantifies whether a goalkeeper concedes more or fewer post-save shots or goals than would be expected given the situations they face.
Goalkeeper Results
For the first model, we want to measure the value of the goalkeepers’ parried saves. In other words, when the keeper has to parry, how “safe” are the zones where the balls end up. Using our model in Allsvenskan, we get the following results:
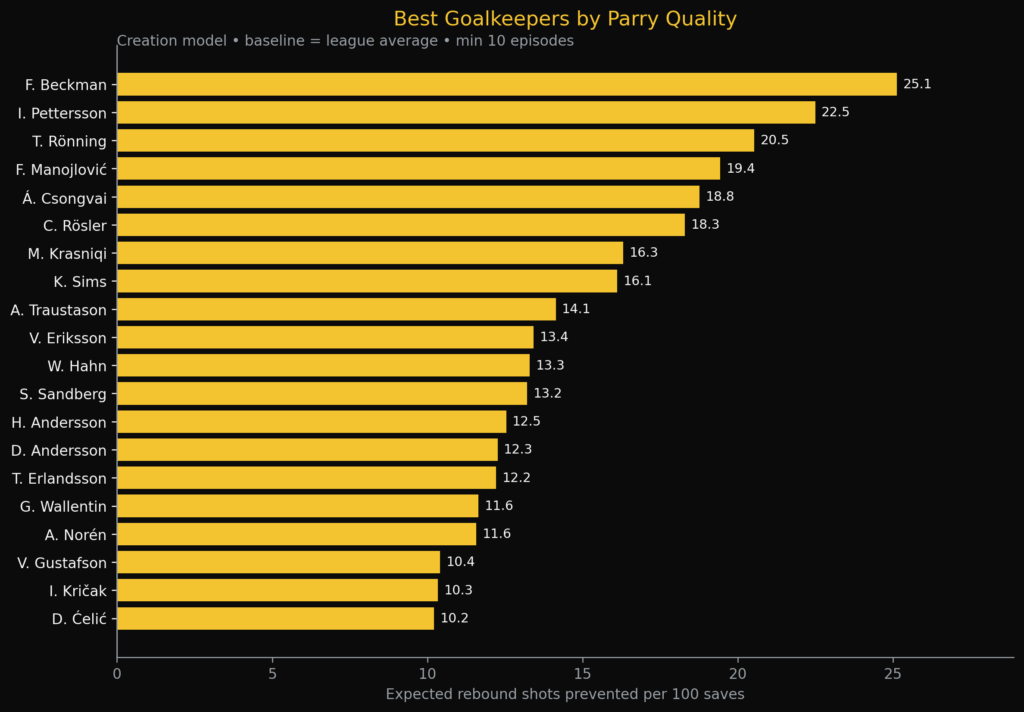
In the bargraph above, we see the Expected robund shots prevented per 100 saves. It shows the quality of the parried saves and the impact on the rebounds shots. As you can see F. Beckman scores highest, as he is expected to prevent 25,1 rebounds per 100 saves he makes. This rougly translate to 25% of the saves.
Now let’s have a look at the rebound goals in relation to the saves.
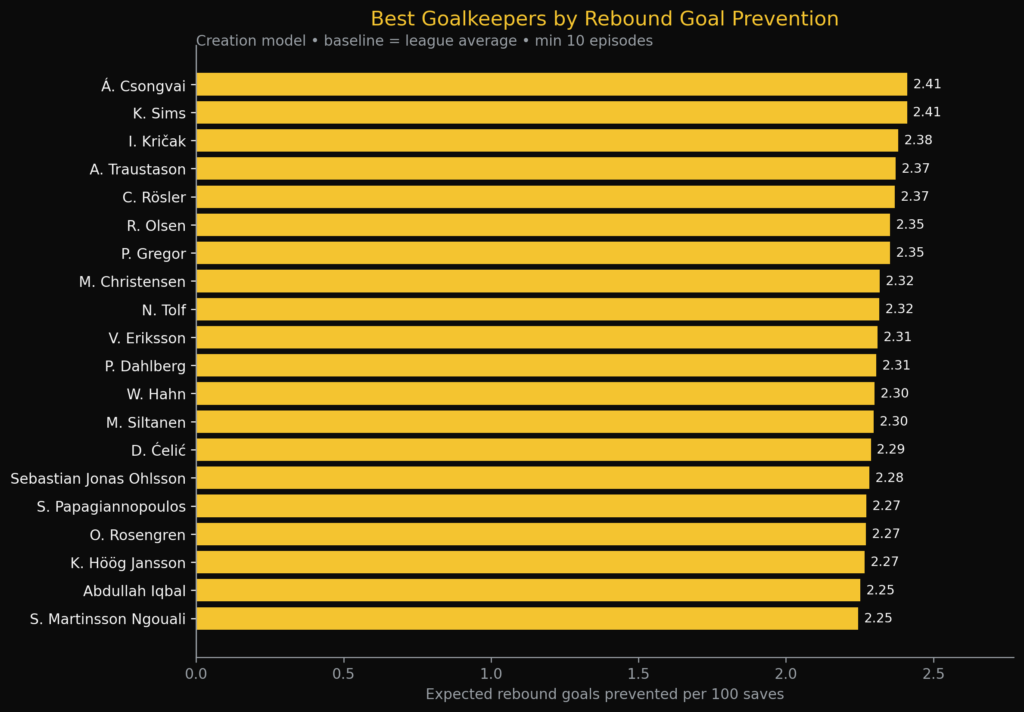
In this bargraph, you see the best goalkeepers per goal prevention from rebounds. It measures the Expected rebound goals prevented per 100 saves in the Allsvenskan. A. Csongvai does perform best in the expected metrics with 2,41 expected rebound goals prevented.
If we go ahead and look at the second model, we can make some interesting observations here as well. The first model focuses on expected prevention in rebounds on the moment of the save, but this second model focuses on the danger after the save. So what prevention of a rebound shot happens after the initial shot.
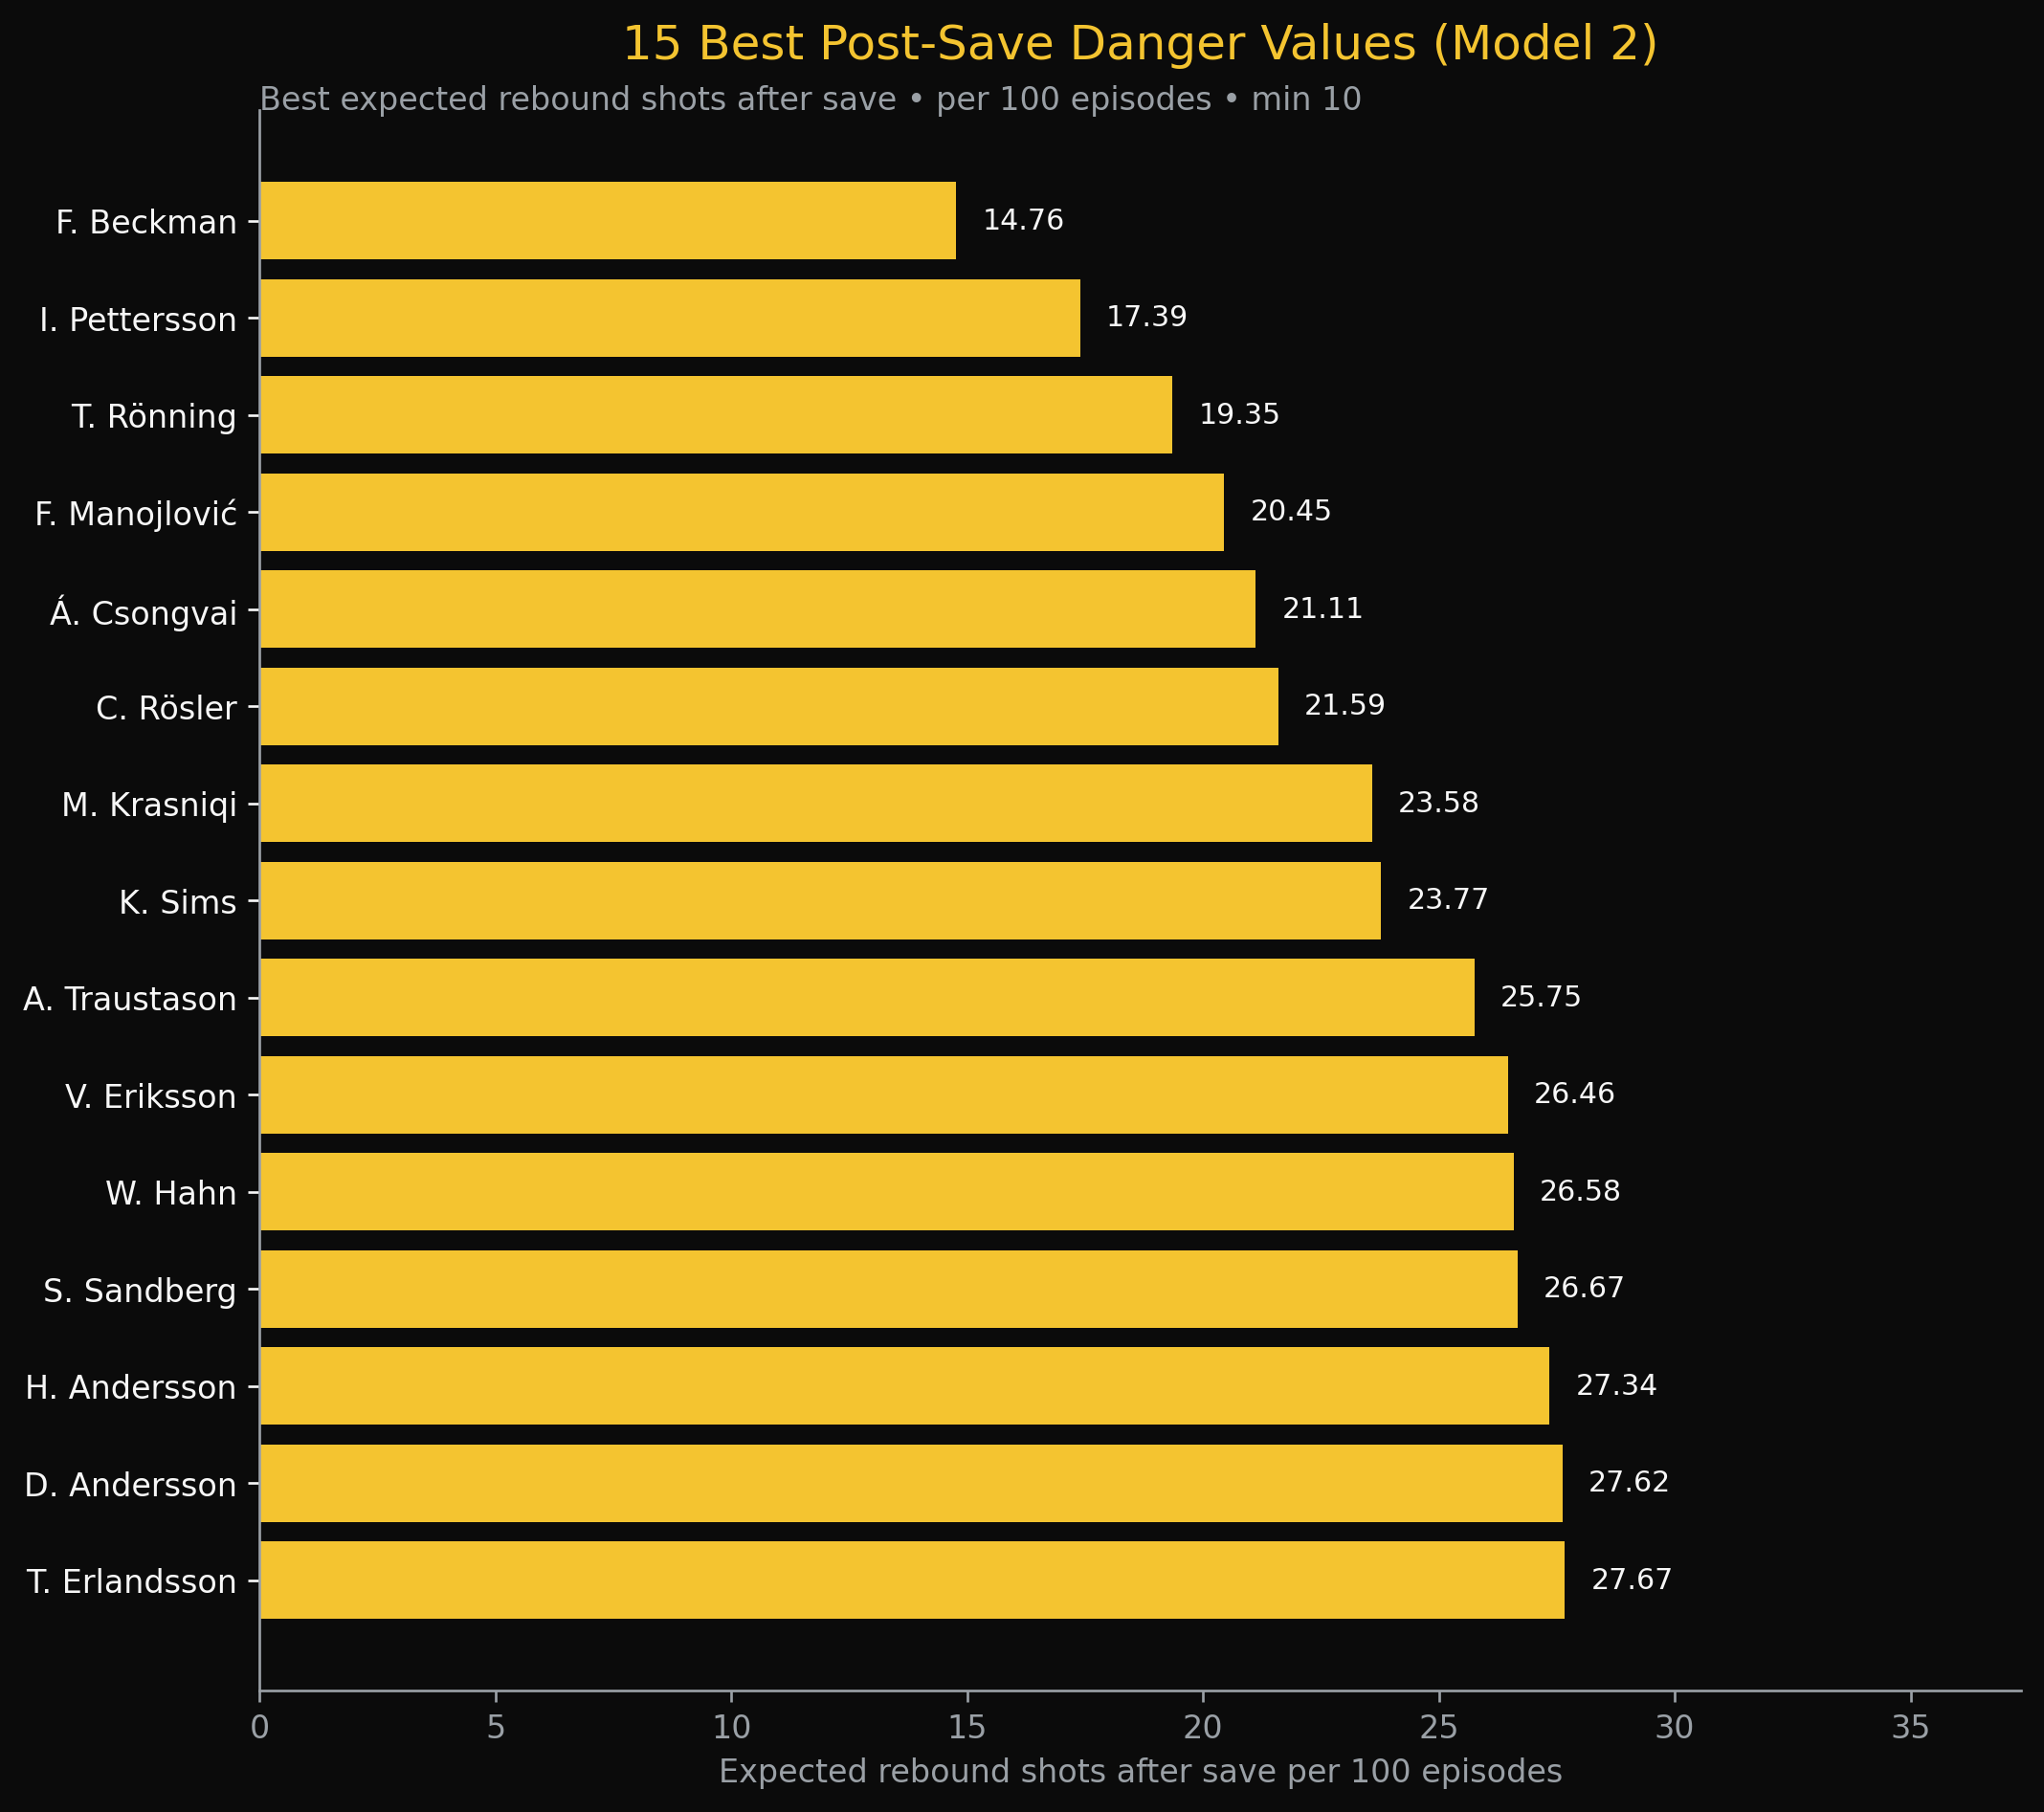
Here you see how many shots are allowed in rebounds. This might seem the same as in model I, but here we are not looking only at the first action after a save, but we are looking at a rebound sequence, meaning that the attacking team gets the rebound.
Beckman does really well, as he only seems to concede 14,76 rebounds shots per 100 saves. Pettersson and Rönning follow closely.
Final thoughts
This work shows that goalkeeper performance does not end at the save, but continues in the seconds that follow. By modelling rebounds as sequences rather than isolated events, the Rebound Model captures a phase of play that is structurally important yet largely ignored in traditional analysis. The Hidden Markov Model consistently separates controlled rebounds from chaotic ones, and the distinction between Parry Quality Value and Post-Save Sequence Value makes clear that creating a safe rebound and surviving the scramble that follows are two different skills. In doing so, the model moves goalkeeper evaluation away from binary outcomes and toward the management of space, time, and danger.
At the same time, the second model highlights the core challenge of sequence-based evaluation: context is no longer static. Once you condition on what happens after the save, the goalkeeper is no longer the sole driver of risk. Defensive reactions, attacker positioning, refereeing decisions, and even small random deflections all influence how a rebound sequence unfolds. This makes attribution inherently harder and increases variance, especially in small samples. The Post-Save Sequence Value therefore has to balance richness against noise, capturing real goalkeeper skill without over-crediting or over-penalising them for events largely outside their control. That tension is not a flaw of the model, but a reflection of football itself—and it underlines why separating technique at the moment of the save from context in the sequence is both necessary and unavoidable.
Citation
admin. (2026, januari 25). Modelling Post-Save Rebound Sequences with Hidden Markov Models. Waltzing Analytics. https://waltzinganalytics.com/models/modelling-post-save-rebound-sequences-with-hidden-markov-models/